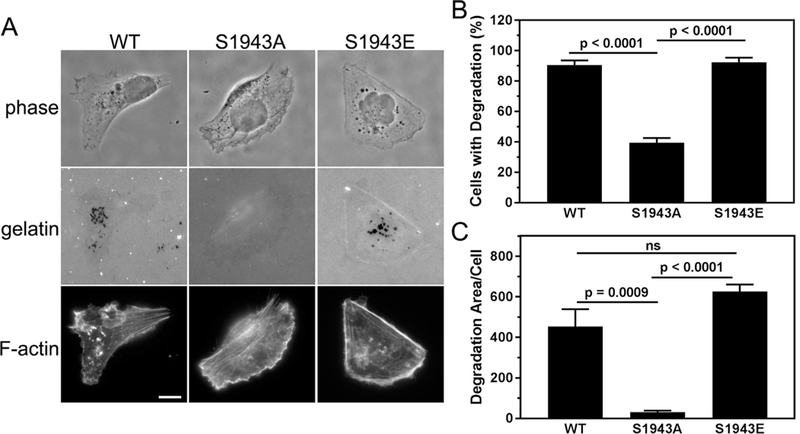
Fig. 3.

Cells deficient for S1943 NMHC-IIA phosphorylation exhibit defects in matrix degradation. (A) Representative images of MDA-MB-231 cells expressing wild- type, S1943A or S1943E NMHC-IIA that were plated on Oregon Green 488-gelatin for 17 h. Areas of degradation appear as dark spots that colocalize with punctate F- actin structures. Bar = 10 μm. (B) Percentage of cells that degrade the gelatin and (C) the average degradation area per cell (pixels/cell). Data represent the mean ± SEM from 4 independent experiments, > 50 cells per condition per experiment. Statistical analyses were performed using ANOVA.
