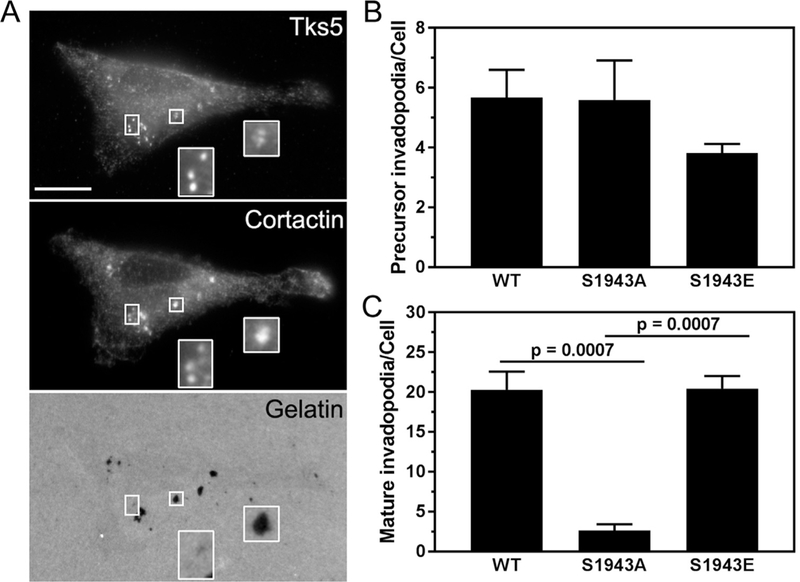
Fig. 5.

Cells deficient for S1943 NMHC-IIA phosphorylation form fewer mature invadopodia. (A) Representative images of MDA- MB-231 cells expressing wild-type, S1943A or S1943E NMHC-IIA that were plated on Oregon Green 488-gelatin for 17 h and stained for the invadopodia markers Tks5 and cortactin. Bar = 10 pm. Insets show magnified images of invadopodium precursors (rectangles) and mature invadopodia (squares). (B and C) Quantification of the number of (B) invadopodium precursors and (C) mature invadopodia per cell. Data represent the mean ± SEM from 3 independent experiments, ≥ 50 cells per condition per experiment. Statistical analyses were performed using ANOVA.
