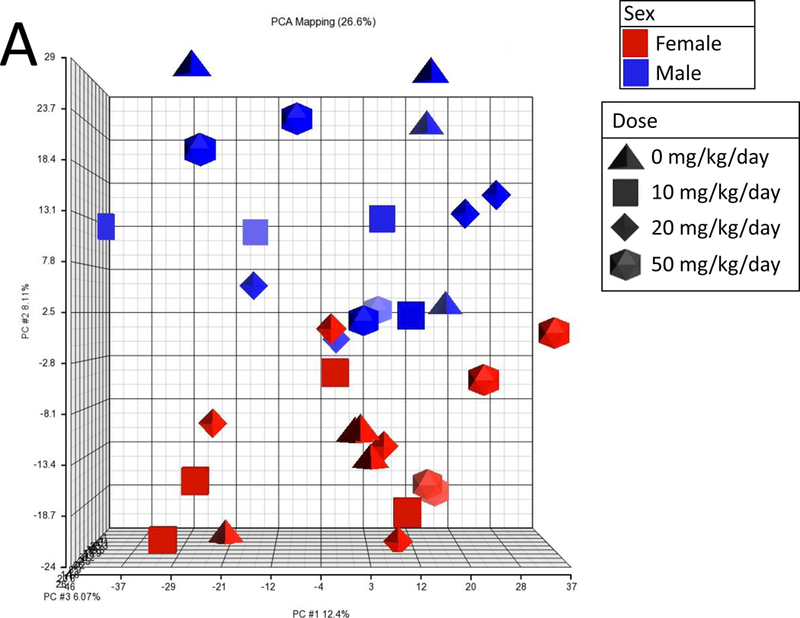
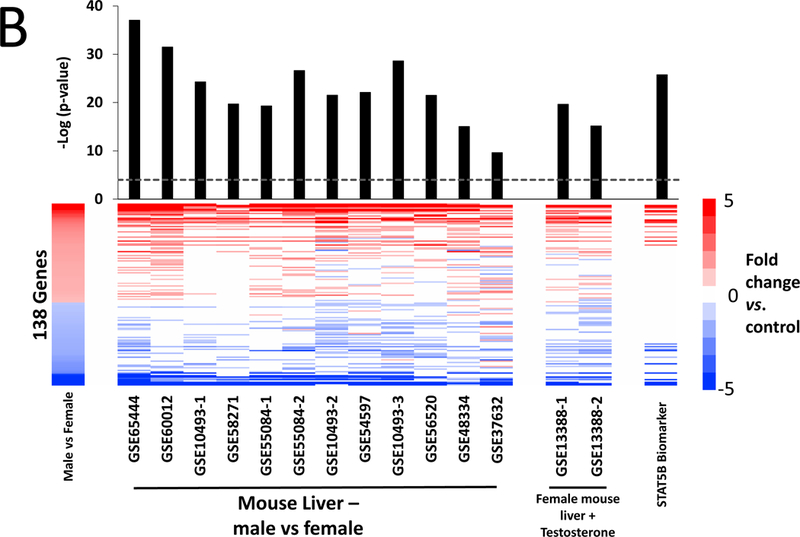
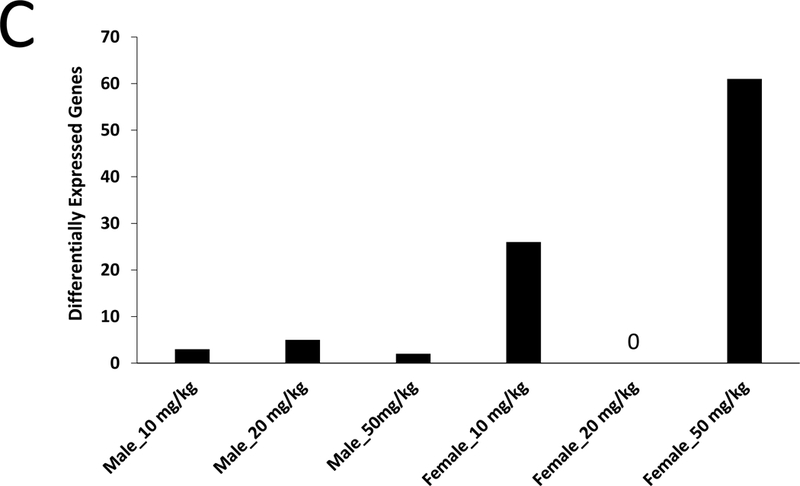
Figure 3. Gene expression analysis of the archival NTP liver samples from mice treated with A4 for 90 days.


Sections of FFPE liver from male and female mice treated by gavage with 0, 10, 20, and 50 mg/kg A4 for 90 days were used to examine the expression of 3099 genes as described in the Methods. A. Principle component analysis of TempO-Seq profiles. B. Genes that were differentially expressed between control males and control females were identified as described in the Methods. The genes were compared to male vs. female comparisons from wild-type adult mice fed normal diets. The GEO number associated with each of the studies is indicated. Comparisons were made using the Running Fisher’s test in the NextBio environment as described in the Methods. The –Log(p-value) of each comparison is shown; positive values represent positive correlations. C. Number of significantly altered genes in each dose group.
