
Figure 2.
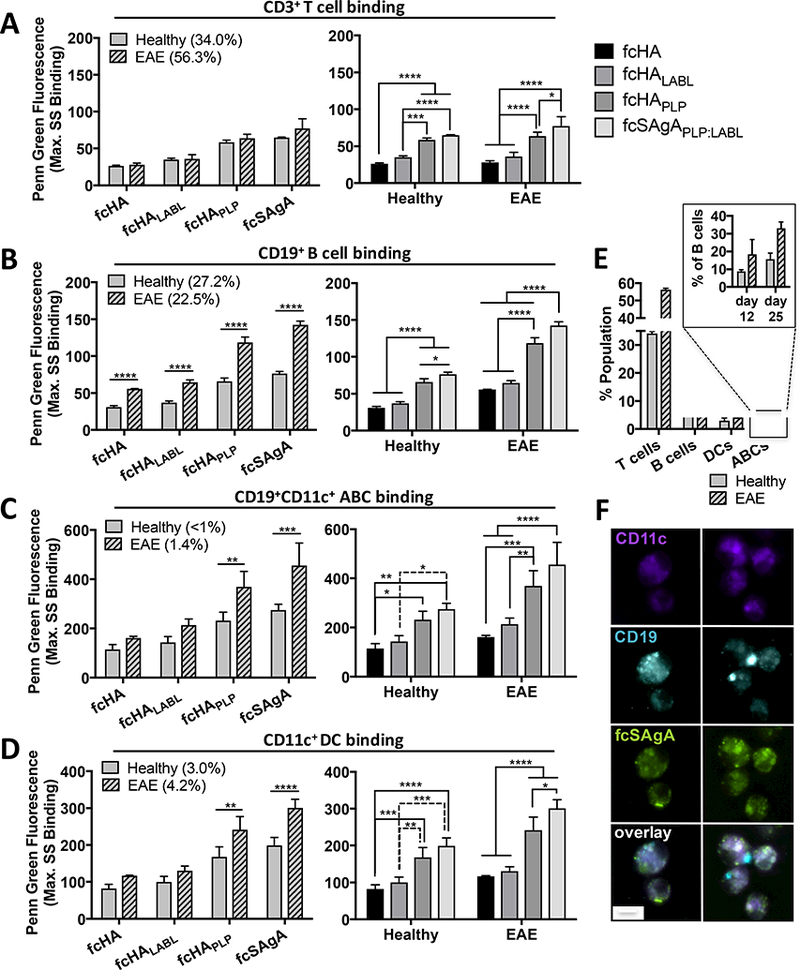
Click conjugate binding (max. SS fluorescence) in EAE versus healthy splenocyte subpopulations isolated at peak of disease (day 12), determined by flow cytometry: A) T cells (CD3+CD19−), B) B cells (CD19+), C) autoimmune-associated B cells (ABCs) (CD19+CD11c+), and D) dendritic cells (DCs) (CD11c+). E) Relative subpopulation composition (% total isolated splenocytes) in healthy versus EAE splenocytes at peak of disease; subset shows ABCs as % of gated B cells on day 12 and 25. Data represent mean ± SD (n=3); statistical significance was determined by two-way ANOVA followed by Sidak’s or Tukey’s post hoc test (*p<0.05, **p<0.01, ***p<0.001, ****p<0.0001). F) Fluorescence microscopy shows high fcSAgAPLP:LABL binding (green) on EAE splenocytes that co-express CD11c (violet) and CD19 (blue), identified as ABCs. Real time binding images of live cells were captured using the M04S plate and CellASIC Onyx Microfluidics platform on an Olympus IX81 inverted Epifluorescence microscope. Magnification: 60X air. Scale bar equals 10 μm.