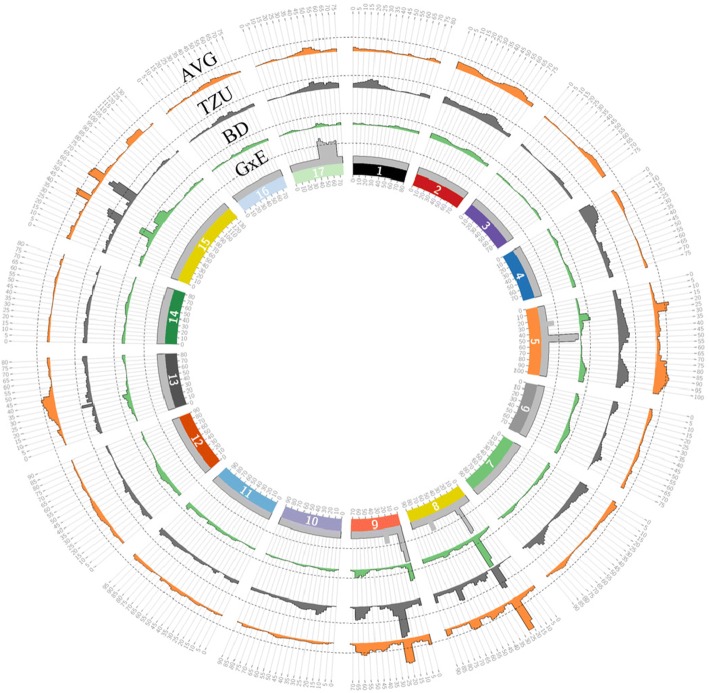
Fig. 5.
QTL positions for main genotypic and GxE effects on VB time. Each circle indicates the type of analysis. Overall mean (AVG) = orange, Tzuba (TZU) = gray, Bet Dagan (BD) = green, interaction (GxE) = light gray. Linkage groups (LGs) are indicated by numbers on the inner ring. Dotted lines indicate LOD thresholds determined by permutation test

