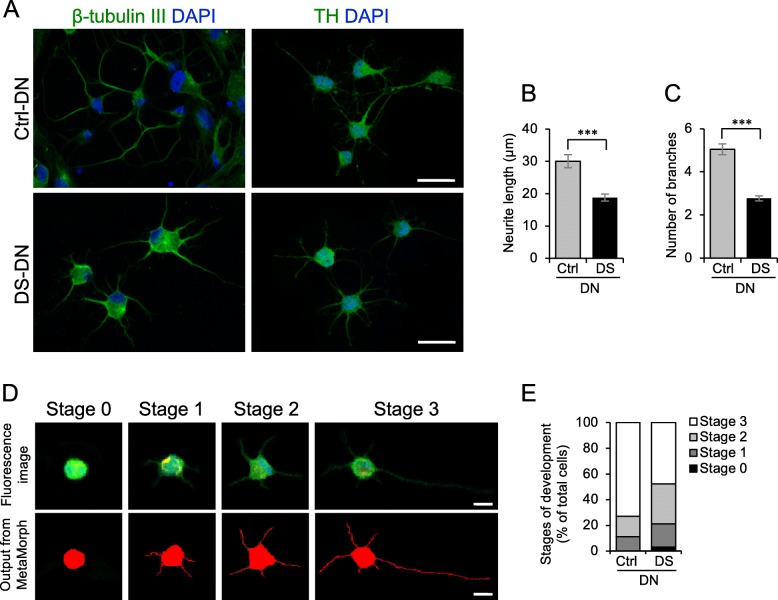
Fig. 2.
DN differentiation of DS-SHED. a Ctrl- and DS-DN cells were observed by immunofluorescence microscopy using anti-β-tubulin III (left panel) and anti-TH (right panel) antibodies. The nuclei were counterstained with DAPI. Scale bar = 50 μm. b, c Neurite length (b) and number of branches (c) of Ctrl- and DS-DN cells were measured. The mean ± SEM from 100 cells is shown. ***P < 0.001. d DN development was classified into 4 stages. The upper panel shows original TH immunofluorescence images, and the lower panel shows the output from Neurite Outgrowth module of MetaMorph software. e A total of 100 differentiated DN were categorized into 4 stages and shown on the graph

