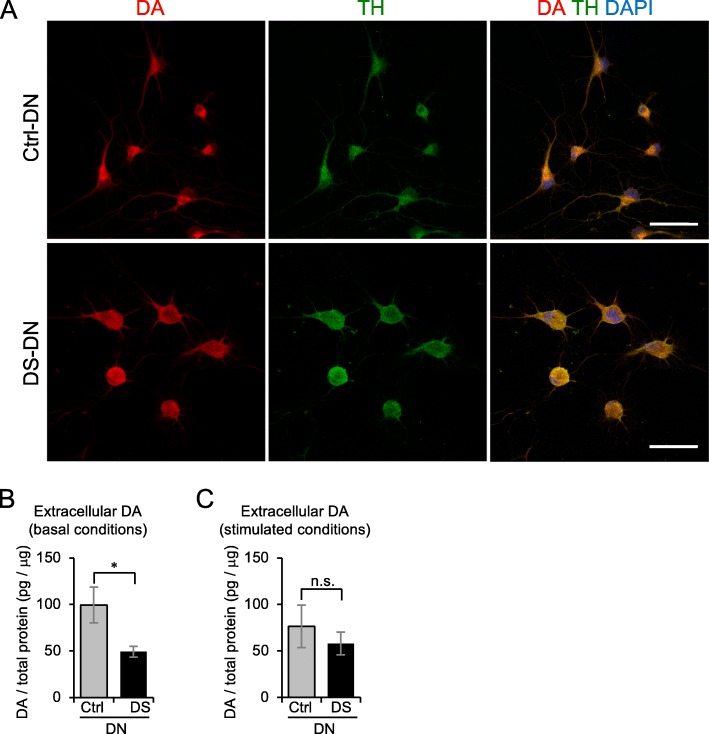
Fig. 3.
Altered DA secretion in DS-DN. a DA expression in Ctrl- and DS-DN cells was observed by immunofluorescence microscopy. Ctrl- and DS-DN cells were stained with anti-DA and anti-TH antibodies, and fluorescence images were captured using the same acquisition settings. Nuclei were counterstained with DAPI; merged images are shown in the right panels. Scale bar = 50 μm. b, c Extracellular DA amount under basal conditions b and glutamate-stimulated conditions c were measured by ELISA. The DA amount was normalized with total protein extracted from each cell. Graphs show the mean ± SEM from four experiments. *P < 0.05; n.s., not significant

