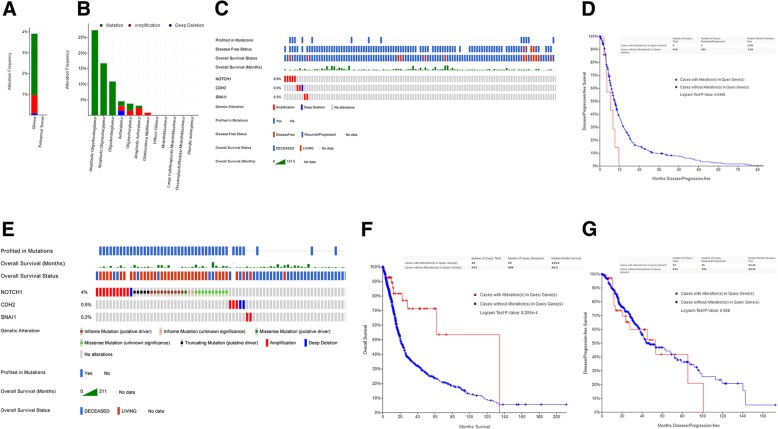
Fig. 1.
The three-gene signature correlated with decreases in DFS and OS in glioma. (a) The comparison of alteration frequency in NOTCH1 between glioma and embryonal tumor. (b) The alteration frequency of NOTCH1 in detailed cancer types. (c) The indicated types of genomic alterations for the three genes in the TCGA data set (GBM, n = 577) within the cBioPortal database are shown; only the proportion of cohorts containing the three-gene signature are included. Each column is for individual tumor. (d) Analysis of DFS using the TCGA cohort (GBM) (P < 0.05). (e) The indicated types of genomic alterations for the three genes in a merged cohort (TCGA, Cell 2016, n = 1084) of Brain Lower Grade Glioma (LGG) and GBM within the cBioPortal database are shown; only the proportion of cohorts containing the three-gene signature are included. Each column is for individual tumor. (f) Analysis of OS using the TCGA cohort (merged LGG and GBM) (P < 0.001). (g) Analysis of DFS using the TCGA cohort (n = 513, LGG) (p = 0.588)

