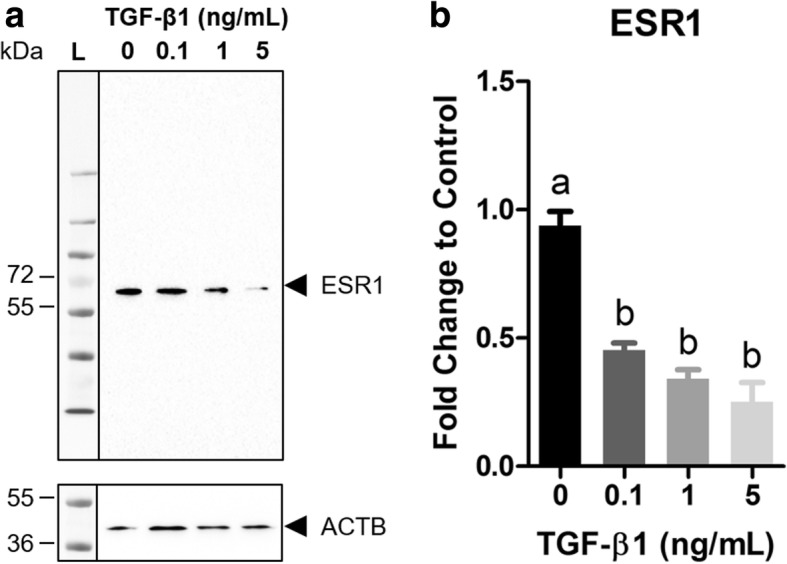
Fig. 4.

TGF-β1 down-regulates ESR1 protein expression. BEAS-2B cells were exposed to TGF-β1 (0.1, 1, and 5 ng/mL) for 48 h and ESR1 protein expression was measured by western blot followed by densitometric analysis in ImageJ. a Representative western blot. b Fold change ESR1 protein expression was normalized to Beta-actin (ACTB) and calculated as fold change to vehicle control (0 ng/mL TGF-β1). Data are mean ± SEM normalized arbitrary density units of duplicate measurements per blot of three independent experiments. Different letters indicate statistically significant (p < 0.05) differences between groups as determined by one-way ANOVA and Newman-Keuls multiple comparison test
