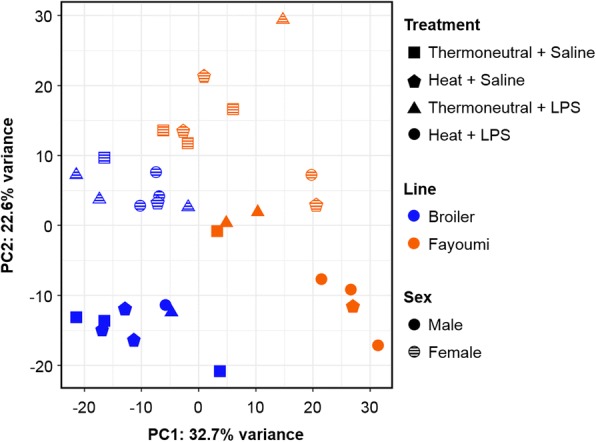
Fig. 1.

Bursal transcriptomes cluster by chicken line and sex. Principal component analysis (PCA) was performed on normalized variance stabilized read counts (from the 500 most variable genes) using the DESeq2 package [39]. The percent of variation explained by each component is shown in the axis titles. Datasets are distinguished by treatment (Thermoneutral + Saline (square), Heat + Saline (pentagon), Thermoneutral + LPS (triangle), Heat + LPS (circle)), line (broiler (blue), Fayoumi (orange)), and sex (male (solid), female (lined)). Lipopolysaccharide (LPS), principal component 1 (PC1), principal component 2 (PC2)
