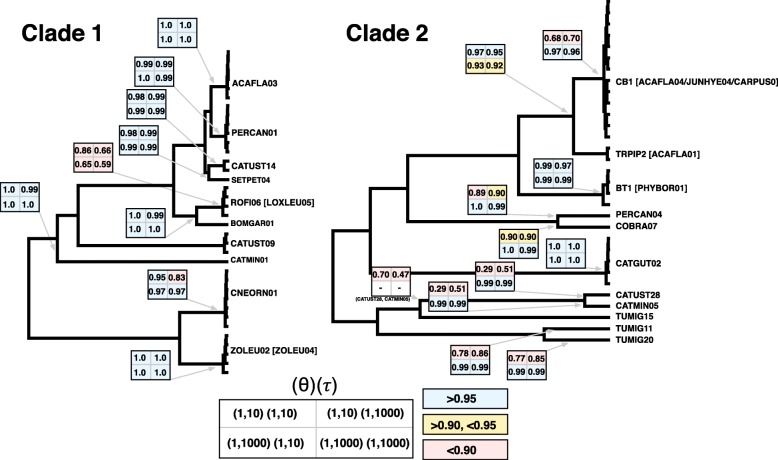
Fig. 3.
Results of BPP species delimitation using the A11 algorithm. Boxes at each node depict the results of the four analyses that were conducted using different diffuse priors for population size and divergence time. If a node was supported to delimit a species with posterior probability > 0.95, the square for that analysis is depicted in blue (squares are depicted in yellow and red for posterior probabilities less than 0.95 and 0.90, respectively). Note that no posterior probabilities are depicted for lineages CATUST09 and TUMIG15, as they were removed from this analysis due to high divergence from all other haplotypes

