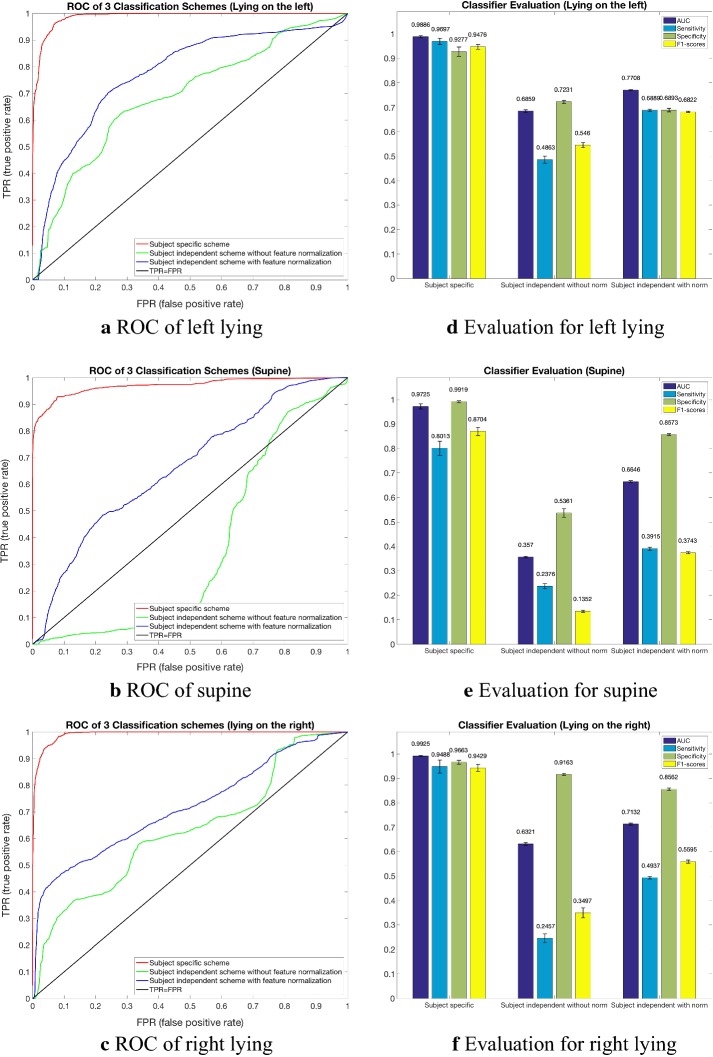
Fig. 6.
The classifier performance of three schemes. Graphs (a–c) are the ROC curves of three kinds of lying position. The red line represents subject specific scheme, green line represents subject independent scheme without features normalization and blue line represents subject independent scheme with features normalization. Bar charts (d–f) present the mean value of AUC, Sensitivity, Specificity and F1-scores of 10 experiments

