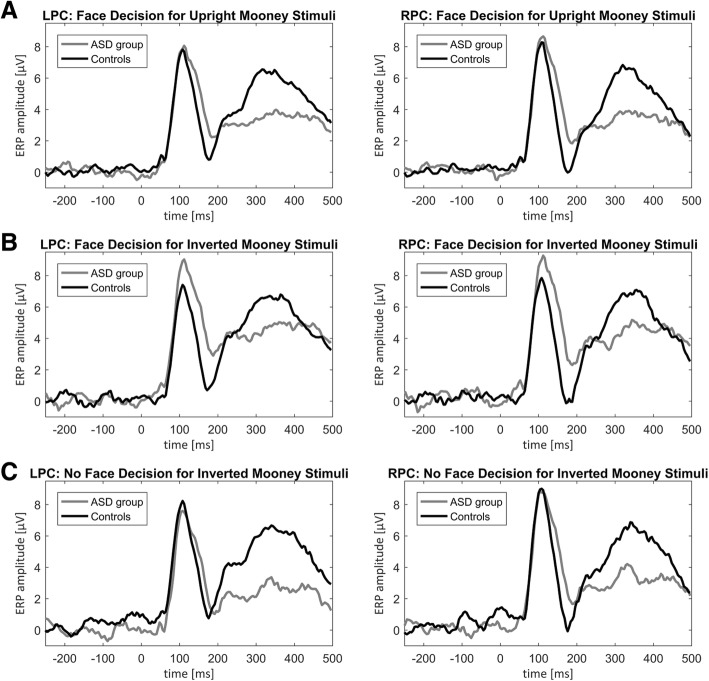
Fig. 3.
ERP differences for face and no face decisions between groups. ERP plots are represented for face decisions in upright Mooney stimuli (a), face decisions in inverted Mooney stimuli (b), and no face decisions in inverted Mooney stimuli (c) separately for the left posterior cluster (LPC) and right posterior cluster (RPC) for controls (gray line) and the ASD group (black line)

