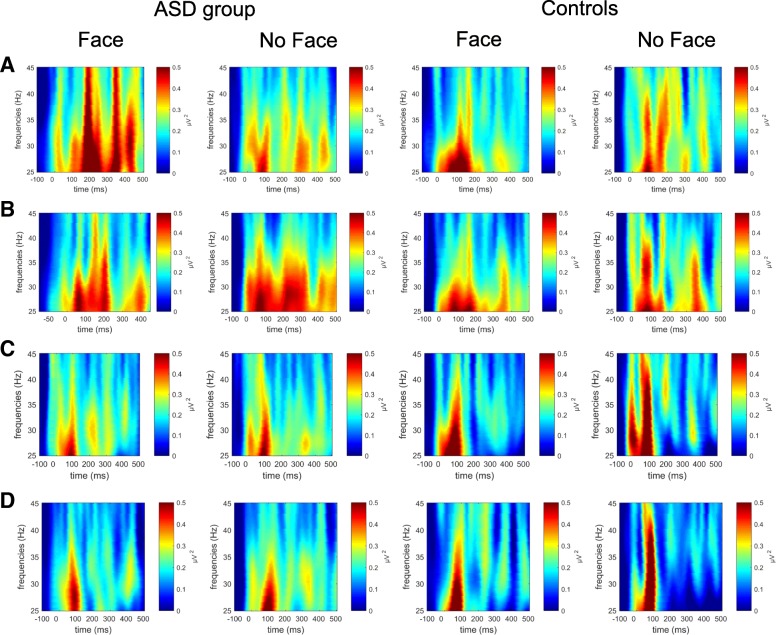
Fig. 4.
Group differences in gamma-band activity for controls and adolescents with ASD. Time-frequency plots for face and no face decisions of the ASD group and controls at the anterior left cluster (a), anterior right cluster (b), posterior left cluster (c), and posterior right cluster (d). The colored scales indicate Z-transformed power values

