Figure 1.
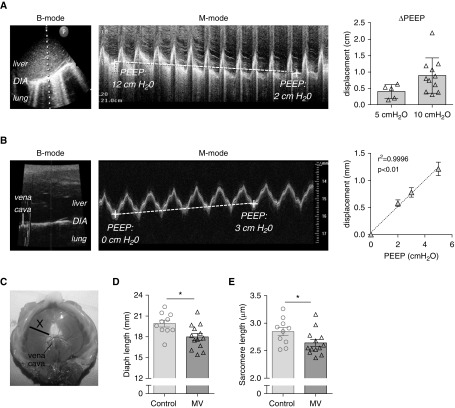
(A) Ultrasonographic view of the diaphragm (DIA) in a critically ill patient in the region of the liver dome, with B-mode image (left) and M-mode image (middle). The vertical dotted line in the left panel shows the location where the M-mode image was obtained, and P indicates the position of the probe. The M-mode image shows the acute effect of a 10 cm H2O positive end-expiratory pressure (PEEP) change on the position of the DIA, measured at end-expiration (indicated by dashed line); note that in this patient PEEP was decreased from 12 to 2 cm H2O, resulting in a cranial DIA displacement. Right: Cranial DIA displacement in critically ill patients caused by a 5 cm H2O PEEP reduction (n = 5) or by a 10 cm H2O PEEP reduction (n = 10); each data point is the average of three measurements per patient. (B) Ultrasonographic view of the DIA in rat during mechanical ventilation in the region of the liver dome is shown, with B-mode image (left) and corresponding M-mode image (middle). The vertical gray line shows the location where the M-mode image was obtained. The M-mode image shows that an increase of PEEP with 3 cm H2O causes an acute caudal movement of the DIA, measured at end-expiration (dashed line). Right panel shows the effect of 2, 3, and 5 cm H2O ∆PEEP on caudal DIA displacement; each data point is the average of five rats. (C) Image of an excised rat DIA, illustrating the midcostal position (X) where a strip was isolated for measurement of DIA fiber and sarcomere length in in vivo–fixated rats. (D) DIA fiber length in in vivo–fixated PEEP-ventilated (2.5 cm H2O) rats and nonventilated rats; each data point represents one rat. (E) DIA sarcomere length in in vivo–fixated PEEP-ventilated (2.5 cm H2O) rats and nonventilated rats; each data point represents one rat. Data in A and B show mean ± SD, and in D and E show mean ± SEM. *P ≤ 0.05. Diaph = diaphragm; MV = mechanical ventilation.

