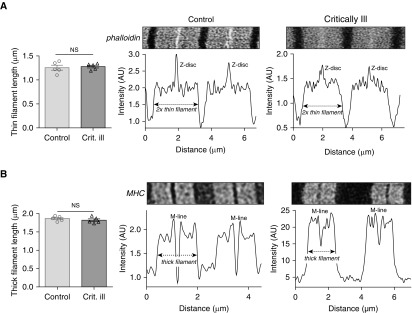
Figure 3.
(A) Deconvolved stimulated emission depletion (STED) superresolution microscopy images of sarcomeres in a diaphragm fiber of a control and a critically ill patient, labeled with AlexaFluor-conjugated phalloidin to visualize the thin filaments. Intensity measurements were used to determine thin filament length, which was comparable between critically ill and control patients. (B) Deconvolved STED superresolution microscopy images of sarcomeres in a diaphragm fiber of a control and a critically ill patient, labeled with MHC (myosin heavy chain) antibodies to visualize the thick filaments, are shown. Intensity measurements were used to determine thick filament length, which was comparable between critically ill and control patients. Note that each data point represents the average of 50 to 100 sarcomeres per subject. Data presented are mean ± SEM. AU = arbitrary units; Crit. ill = critically ill patient; NS = not significant.

