Figure 5.
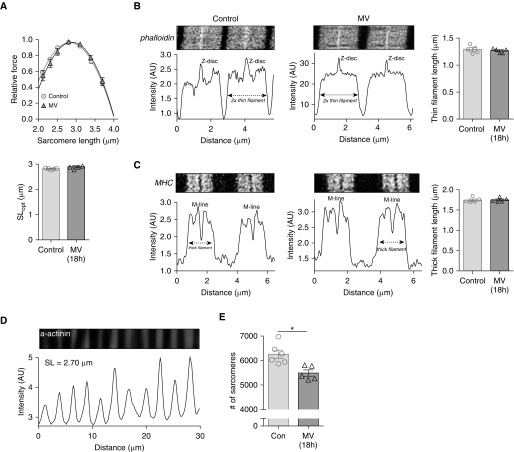
(A) Top: Force–sarcomere length relation of diaphragm fibers of 18-hour mechanically ventilated (MV) rats and control rats; note that both relations overlap. Force is presented as percentage of maximal force; each data point is the average of five rats. Bottom: SLopt is comparable between MV and control rats. Note that ∼90% of fibers were fast-twitch, and therefore both fiber types were pooled. In line with previous work (32, 50), the maximal force-generating capacity was lower in fibers of MV rats (data not shown). (B) Deconvolved stimulated emission depletion (STED) superresolution microscopy images of sarcomeres in a diaphragm fiber of a control and an 18-hour MV rat, labeled with AlexaFluor-conjugated phalloidin to visualize the thin filaments. Intensity measurements were used to determine thin filament length, which was comparable between 18-hour MV and control rats. Each data point represents one rat. (C) Deconvolved STED superresolution microscopy images of sarcomeres in a diaphragm fiber of a control and an 18-hour MV rat, labeled with MHC (myosin heavy chain) antibodies to visualize the thick filaments. Intensity measurements were used to determine thick filament length, which was comparable between 18-hour MV and control rats. Each data point represents one rat. (D) Typical α-actinin staining in a rat diaphragm fiber to visualize the Z-discs to determine sarcomere length. (E) The number of sarcomeres in series is significantly lower in 18-hour MV rats than in control rats. Each data point represents the average of one rat; 2,000 to 3,000 sarcomeres were measured per rat. Data presented are mean ± SEM. *P ≤ 0.05. AU = arbitrary units; Con = control; SL = sarcomere length; SLopt = sarcomere length at which maximal force is generated.

