
Figure 1.
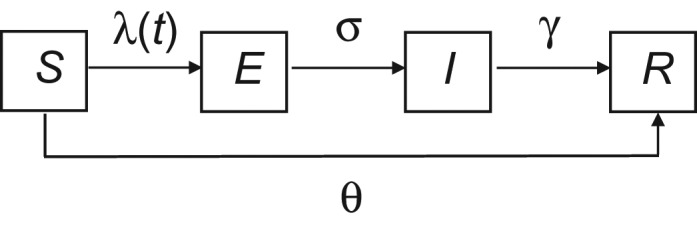
Schematic representation of disease states, flow between states, and parameters controlling flow in a model of a measles outbreak in an Amish community, Ohio, 2014. The model represents a constant (closed) population in which individuals are either susceptible to (S) or recovered from (R) measles infection and disease, and into which measles introduction occurs (i.e., a particular number of infectious persons (I) is introduced). Persons in the susceptible pool become exposed at the force of infection, λ(t), and then progress through the exposed preinfectious (E) and infectious (I) stages before arriving in the removed compartment (R), where individuals are immune. σ and γ denote the rates at which individuals progress into the I and R compartments, respectively. The model tracks, each day, the number of persons in each of the compartments, and it incorporates stochasticity using the adaptive tau-leaping algorithm (11). The effect of the measles-mumps-rubella vaccination campaign is represented by θ, the number of unvaccinated persons who received a dose of measles-mumps-rubella vaccine during containment efforts. Unvaccinated persons are removed from the S compartment and added to the R compartment (bypassing E and I) based on the date on which measles-mumps-rubella vaccine was administered.