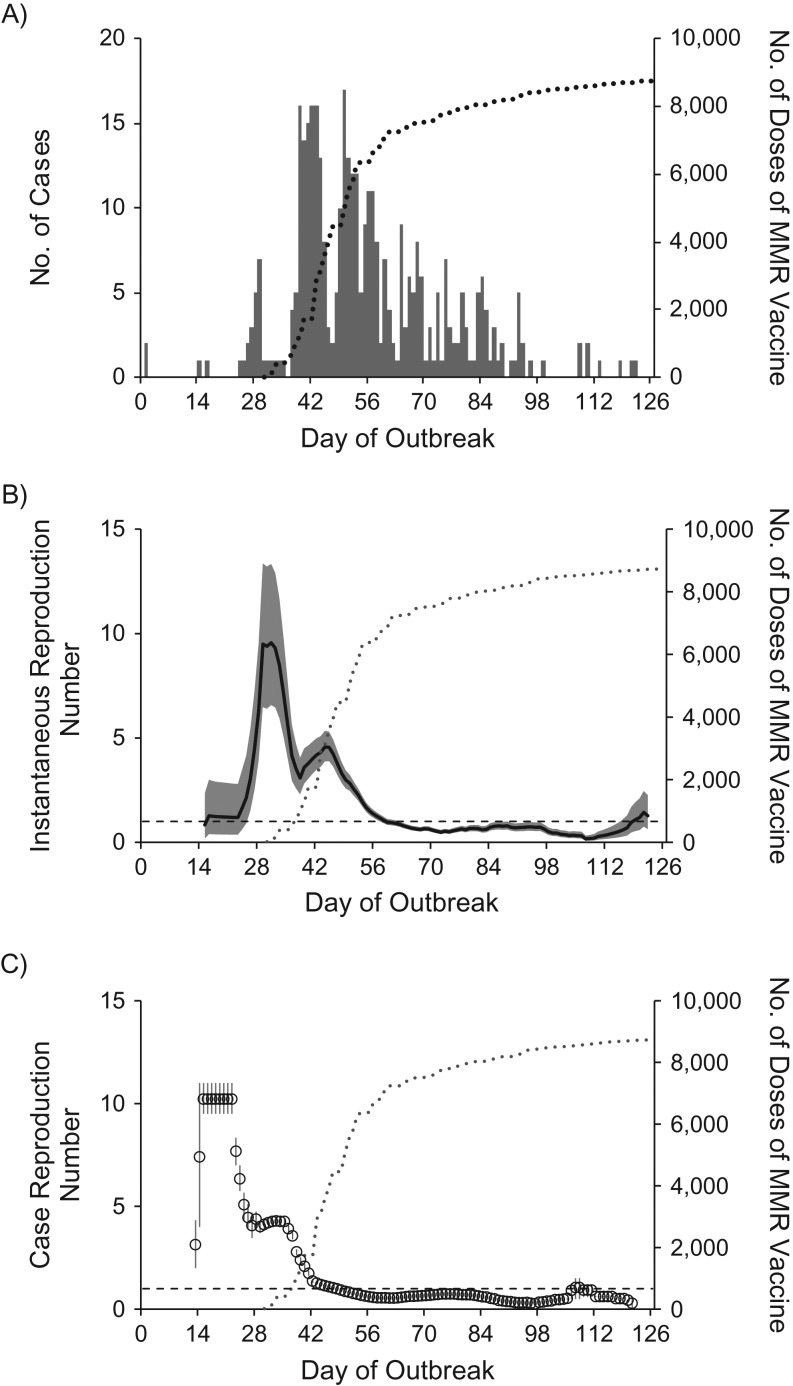
Figure 2.
Daily numbers of measles cases and daily estimates of the instantaneous and case reproduction numbers during a measles outbreak in an Amish community, Ohio, 2014. A) Daily total numbers of confirmed outbreak-associated measles case-patients according to day of rash onset (n = 383). For 3 case-patients, the date of rash onset could not be determined, so the date of illness onset +2 days (the median number of days between illness onset and rash for all other cases) is shown. One laboratory-confirmed case-patient did not develop rash, so the date of illness onset is shown. B) Daily estimates of the instantaneous reproduction number Rt over sliding 14-day windows. The black line shows the median estimate, the gray areas the 90% confidence intervals, and the horizontal dashed line the threshold value Rt = 1. C) Daily estimates of the case reproduction number (Rc) over sliding 14-day windows. The circles show the mean estimate, the vertical bars the 90% confidence intervals, and the horizontal dashed line the threshold value Rc = 1. As expected, estimates of Rc were ahead of the estimates of Rt, with the highest estimate of Rc occurring around the end of the third week, approximately 1 serial interval (11–12 days) before the peak in Rt; the peak in Rt in the middle of the fifth week indicates increased transmissibility among cases with rash onset 1 generation before (8). Superimposed in all 3 panels is the cumulative number of daily doses of measles-mumps-rubella (MMR) vaccine given at local health department vaccination clinics during the outbreak (gray dotted lines).

