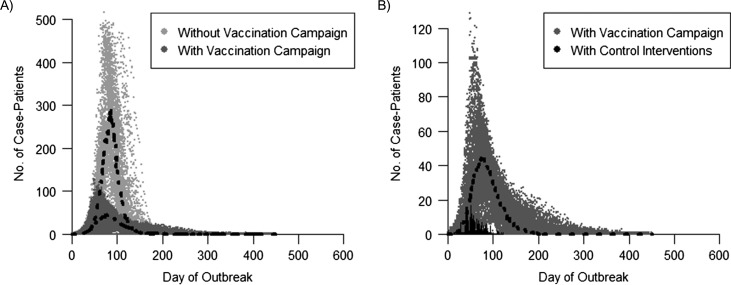
Figure 3.
Projected and observed daily incidence of measles cases during a measles outbreak in an Amish community, Ohio, 2014. A) Comparison of model trajectories with and without the measles-mumps-rubella vaccination campaign. B) Comparison of the model trajectories including the vaccination campaign with the observed epidemic curve (which included other control measures). Results from 100 iterations of the modeled epidemic curves are presented, assuming an initial vaccination coverage of 45%; the black dots show the median daily measles case incidence of all iterations. Note that the scales of the y-axes differ. Cumulative case incidence was as follows: model without vaccination—12,946 cases (90% confidence interval (CI): 12,919, 12,968) over the course of 207 days (90% CI: 187, 233); model with vaccination campaign—3,353 cases (90% CI: 2,551, 4,003) over the course of 247 days (90% CI: 183, 370); observed with control interventions—383 cases over the course of 121 days.

