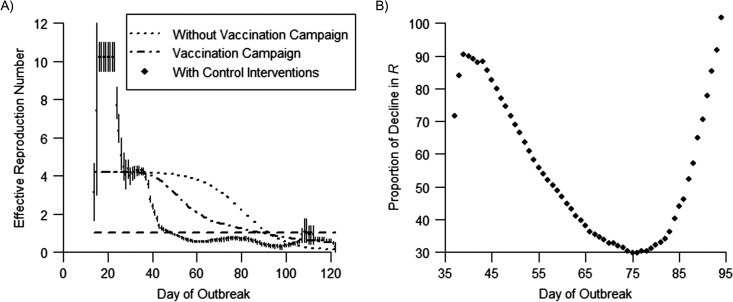
Figure 4.
Observed and projected daily estimates of the case reproduction number (Rc) and proportion of decline in Rc attributed to community and public health social distancing during a measles outbreak in an Amish community, Ohio, 2014. A) Observed and projected daily estimates of the case reproduction number (Rc) over sliding 14-day windows; the dotted and dotted-dashed lines show the median Rc of 100 model trajectories without and with the measles-mumps-rubella vaccination campaign, respectively, assuming an initial vaccination coverage of 45%. The diamonds show the observed mean Rc estimate (which included other control measures and changes in community behavior), the bars represent the 90% confidence intervals, and the horizontal dashed line indicates the threshold value Rc = 1. Observed and projected Rc estimates were derived from the likelihood-based estimation procedure and directly from the models, respectively. B) Proportion of decline in Rc attributable to changes in community behavior (social distancing) and other control efforts (isolation, quarantining) during the outbreak; data presented cover the period from the initiation of containment efforts to the time when projected estimates of Rc fall below 1. The reduction in transmissibility that could be ascribed to these factors varied from approximately 30% to 90% during the outbreak.

