Figure 1.
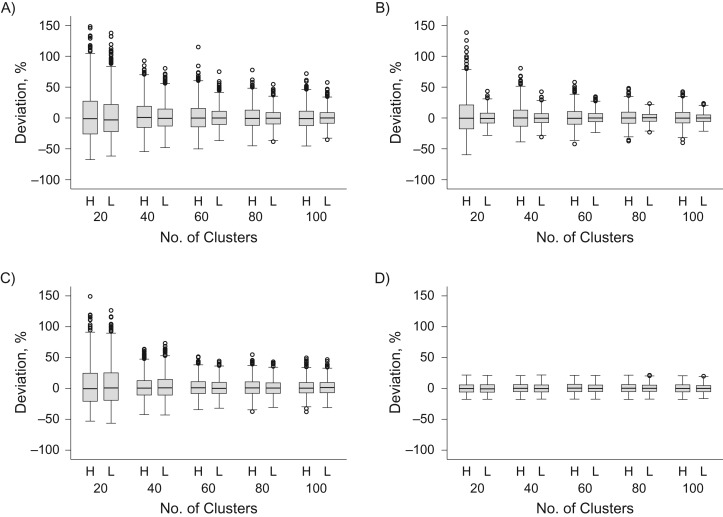
Validity of odds ratio estimates from a simulated cluster-randomized test-negative design study, under the null hypothesis of no intervention effect. Box-and-whisker plots show the distribution of odds ratio estimates from 1,000 simulated cluster-randomized allocations of a hypothetical dengue preventive intervention, displayed as the % deviation from the expected odds ratio = 1, assuming that the true intervention efficacy is zero. The 10 different scenarios within each graph represent a variable number of clusters under study (20–100) and 2 scenarios of the intercluster coefficient of variation (k) in baseline test-negative illness incidence: high (H; k = 0.5) or low (L; k = 0.25). Intercluster variation in baseline dengue incidence was constant in all scenarios (k = 0.5). Random allocation of the intervention was either unconstrained (A) or constrained to ensure balance between the study arms (within 10%) in baseline dengue incidence (B), test-negative illness incidence (C), or both dengue and test-negative illness incidence (D). Note: 5 odds ratio estimates from panel A (4/1,000 simulations with 20 clusters and high k, and 1/1,000 simulation with 20 clusters and low k) and 2 odds ratio estimates in panel C (2/1,000 simulations with 20 clusters and low k) had a deviation value greater than 150% and are not shown on the graph.

