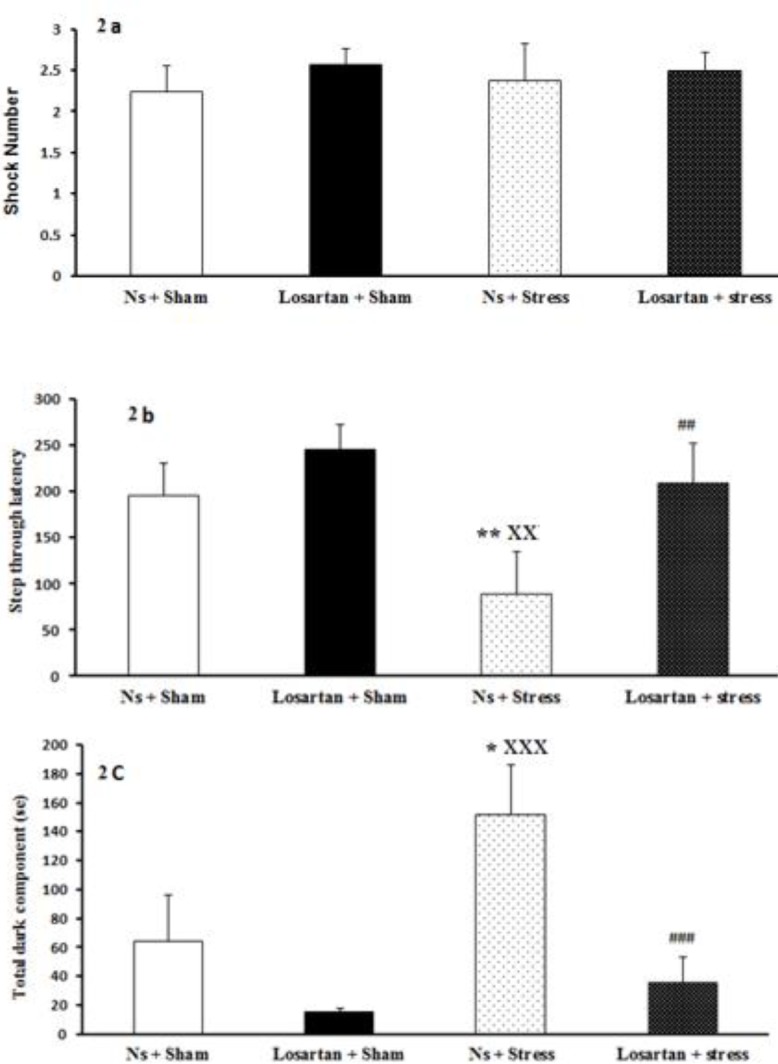
Figure 2.

Effect of stress and losartan in passive avoidance test. A) shock number, B) step through latency, C) total dark component. Results are expressed as mean±SEM (ANOVA test, Tukey’s test for comparisons between groups; *P<0.05, **P<0.01 when compared to Ns+Sham group; xxP<0.01, xxxP<0.001 when compared to Losartan+Sham group; ## P<0.01, ###P<0.001 when compared to Ns +Stress group)
