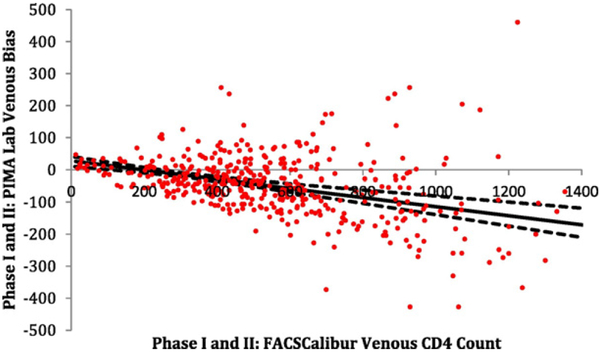
Fig. 3.
Bias of the validation Phase I and II (N = 427) FACSCalibur™ venous reference compared to the Pima™ laboratory venous CD4+ T-lymphocyte counts. Note to Fig. 3. The solid black line is the mean bias line estimated from the weighted least squares (WLS) model and the dashed black lines are the 95% CI for the mean bias line. Minimum bias occurs where the estimated WLS line crosses the x-axis (~195). All units are in cells/μL.

