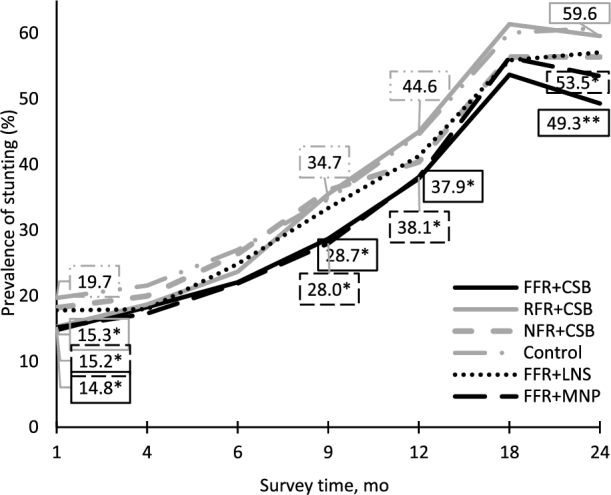
FIGURE 3.

Estimated marginal mean prevalence of stunting (length-for-age z score <−2) among children in treatment compared with control groups at 1, 4, 9, 12, 18, and 24 mo of age. Estimated marginal means (unadjusted means are presented in Tables 5 and 6), *P < 0.05, **P < 0.01 for impact on stunting of treatment group [FFR + CSB (n = 576); RFR + CSB (n = 575); NFR + CSB (n = 542); FFR + LNS (n = 550); FFR + MNP (n = 587)] compared with the control group (n = 574) (Table 4). CSB, corn-soy blend; FFR, full family ration; LNS, lipid-based nutrient supplement; MNP, micronutrient powder; NFR, no family ration; RFR, reduced family ration.
