Figure 1.

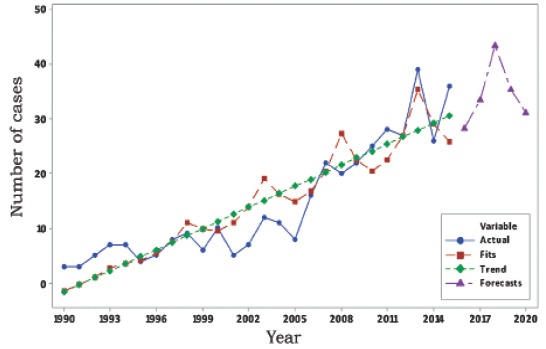
Time series decomposition plot for frequency. Trend in the incidence of kidney cancer from 1990 to 2015 and a forecast for the period from 2016 to 2020 (fitted trend equation Yt = -2.91 + 1.286×t). Yt - fitted trend t

Time series decomposition plot for frequency. Trend in the incidence of kidney cancer from 1990 to 2015 and a forecast for the period from 2016 to 2020 (fitted trend equation Yt = -2.91 + 1.286×t). Yt - fitted trend t