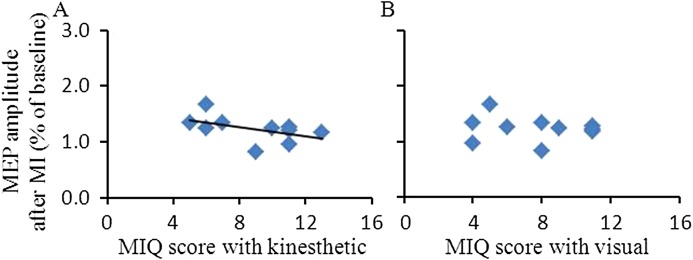
Figure 3. Relationship between MIQ score and MEP amplitude after MI in the abductor pollicis brevis muscle.
The abscissas indicate MIQ score with kinesthetic items (A) and with visual items (B). The ordinates indicate the MEP amplitude at T20 after MI. The values were expressed as the percentage of MEP amplitude after the interventional protocol to the MEP amplitude measured before the interventional protocol (baseline). The dark line represents a regression line indicating a positive correlation between MI ability (lower value of MIQ score represents the higher clarity of MI) and intracortical facilitation after MI. Abbreviations: MIQ, movement imagery questionnaire; MI, motor imagery; MEP, motor evoked potential.

