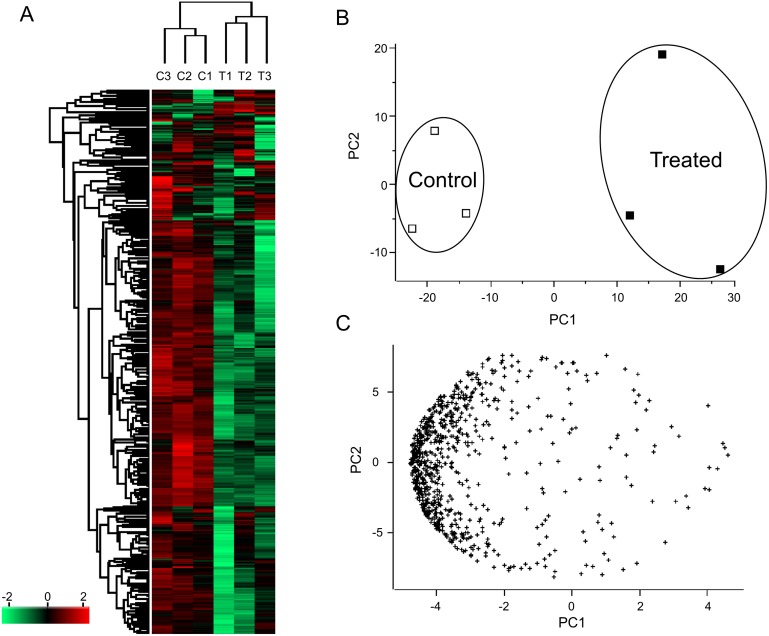
Figure 2. Clustering (A) and principle component analysis (B and C) of Persicaria minor proteome.
Three biological replicates (average of two to three technical replicates each) were run for both Control (C1, C2 and C3) and Treated (T1, T2 and T3) samples. The correlation variances explained by the PC1 component is 61.2% while for PC2 component is 18.5% for both the score (B) and loading (C) plots.

