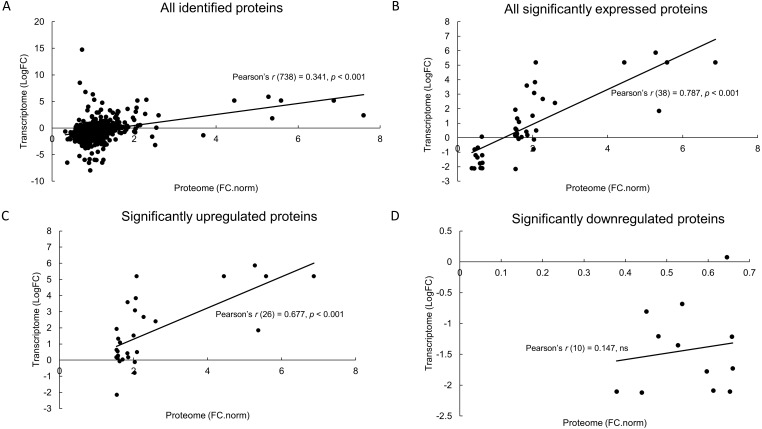
Figure 4. Correlation analysis between proteomics SWATH-MS data and published transcriptome RNA-seq data.
Identified proteins (normalized fold change (FC.norm), this study) were compared with corresponding transcripts (Log2 fold change, LogFC) (Rahnamaie-Tajadod et al., 2017) using Pearson’s product moment correlation coefficient, r. Both datasets were compared based on either all identified proteins (A), all significantly expressed proteins (B), only significantly upregulated proteins (C) and only significantly downregulated proteins (D). Significant correlation was measured using a regression analysis at p < 0.001. ns, not significant.

