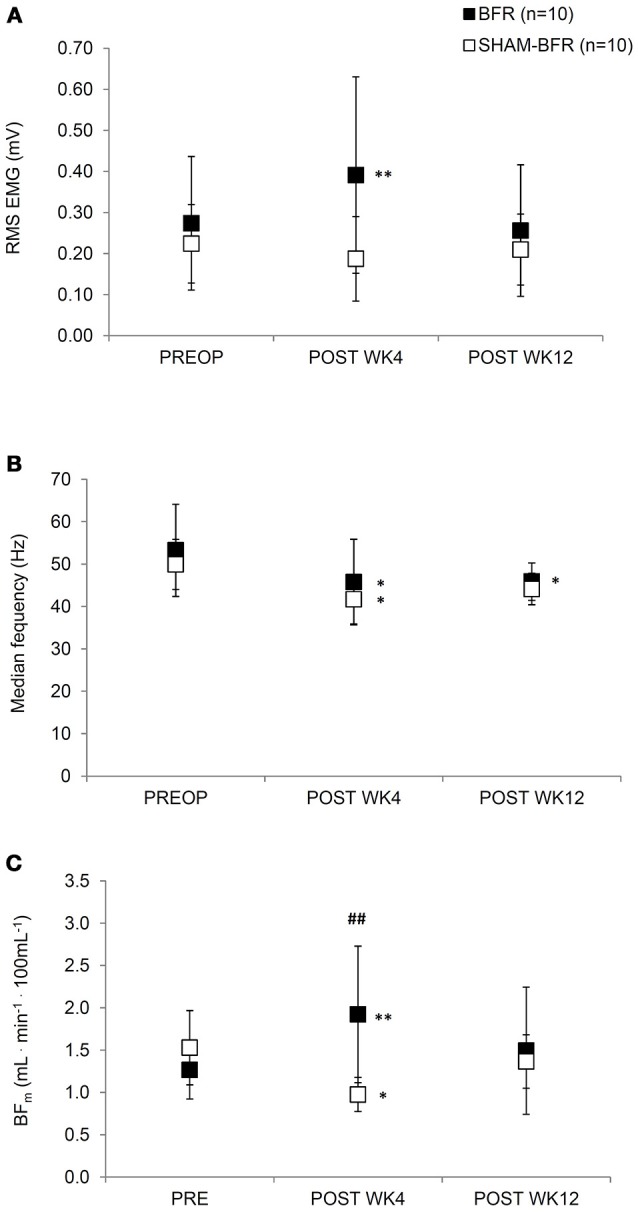
Figure 2.

Mean (SD) values of root mean square EMG amplitude (A), median EMG frequency (B) and blood flow (C) of the affected leg during sustained contraction of quadriceps femoris muscle at 30% MVIC torque for both BFR and SHAM-BFR group prior to (PREOP), at 4 weeks (POST WK4) and at 12 weeks (POST WK12) after surgery. ##denotes statistical difference between groups at p < 0.01. *,**denote statistical difference compared to PREOP values at p < 0.05 and p < 0.01, respectively.
