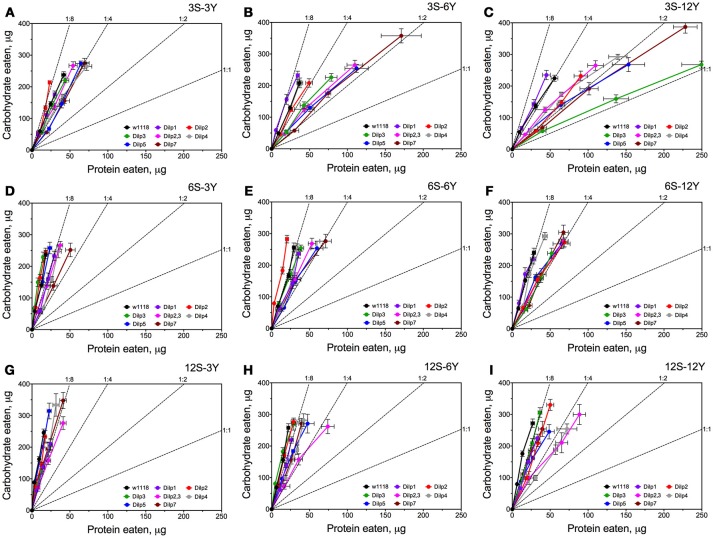
Figure 3.
Nutrient intake trajectories resulting from volumes ingested of the two food solutions (sucrose and yeast) for all fruit fly lines tested. Data are n = 3 replicates (each containing 3–8 flies) for each diet and fly line combination. Panels (A–I) correspond to dietary treatments 3S-3Y, 3S-6Y, 3S-12Y, 6S-3Y, 6S-6Y, 6S-12Y, 12S-3Y, 12S-6Y, and 12S-12Y.

