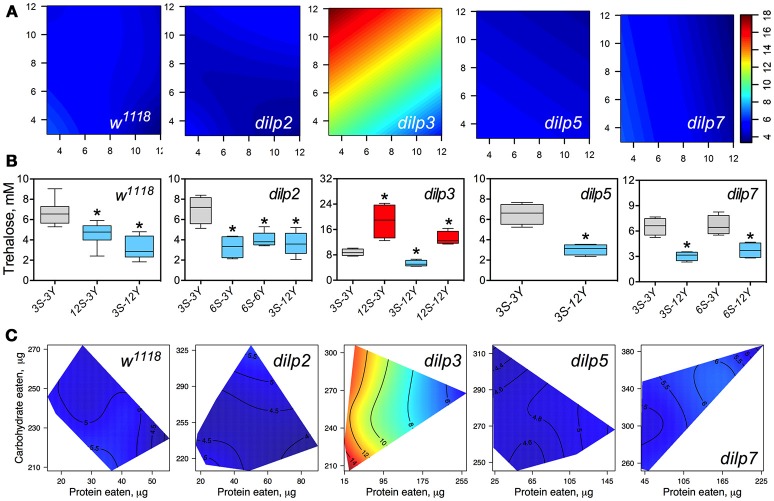
Figure 5.
The effect of mutations on dilp genes on the diet-dependent pattern of trehalose concentration in fruit fly hemolymph. (A) Dietary response surfaces representing dependence of concentration of trehalose in fly hemolymph (mM) on concentrations of yeast and sucrose in the diet. There were tested nine combinations of sucrose (3, 6, and 12%) and yeast (3, 6, and 12%). Axes' titles are the same as in Figure 4. In each case, the flies of tested lines were able to choose between of sucrose- or yeast-containing medium. All five surfaces are placed under one scale. (B) The remarkable differences between hemolymph trehalose values in flies of each line kept on different diets. Red-colored boxes designate statistically significant increase (indicated by the asterisk; p < 0.05, Tukey's test with Bonferroni correction) whereas blue-colored boxes designate statistically significant decrease as compared to the values for flies diet treatment 3S-3Y designated by gray color box. (C) Dietary response surfaces showing dependence of hemolymph glucose in wild type and dilp mutant lines on amounts of protein and carbohydrate consumed. Each surface has own scale shown by contour lines. Data are n = 3–6 replicates for each diet and fly line combination.

