
FIGURE 1.
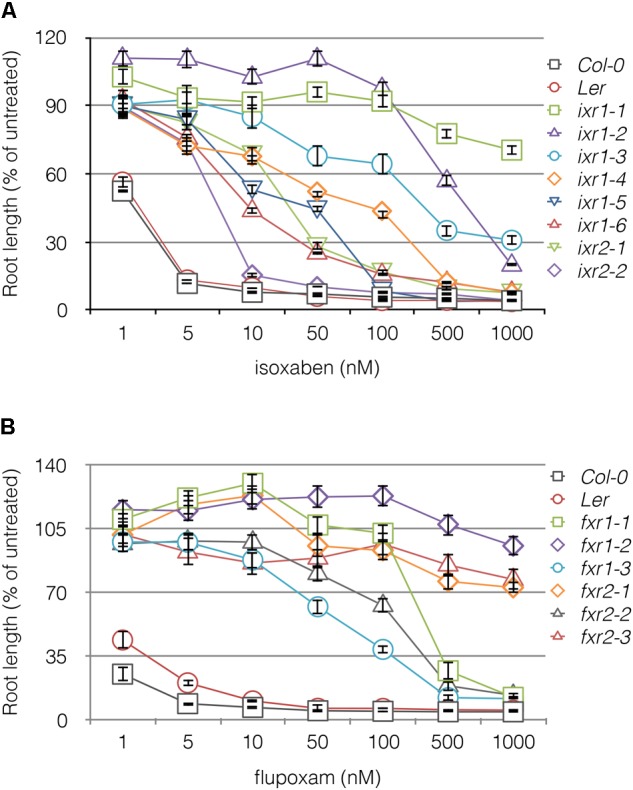
Resistance profiles of ixr and fxr mutants to isoxaben (A) and flupoxam (B). The root lengths of 5 days old seedlings plotted against increasing concentrations of CBI. The vertical axis is expressed as a percentage of the root lengths on media containing no herbicide (untreated). Values are averages ± SD (n ≥ 20).