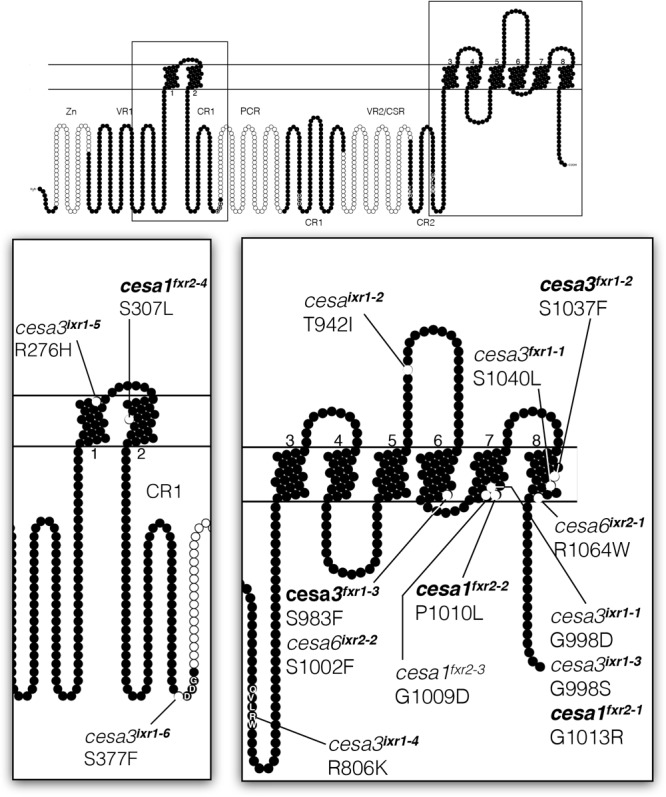
FIGURE 2.

Diagram showing relative positions of ixr and fxr missense mutations on a generalized CESA protein. Structure is based on the CESA3 sequence and generated with Protter software (Omasits et al., 2014) with transmembrane topology prediction done with Phobius (Käll et al., 2004). The positions of CESA1 and CESA6 missense mutations are positioned at equivalent positions on the diagram based on sequence similarity alignments. Zn = zinc finger domain; VR = variable regions; CR/CSR = class specific regions; P-CR = plant-conserved region.
