FIGURE 4.

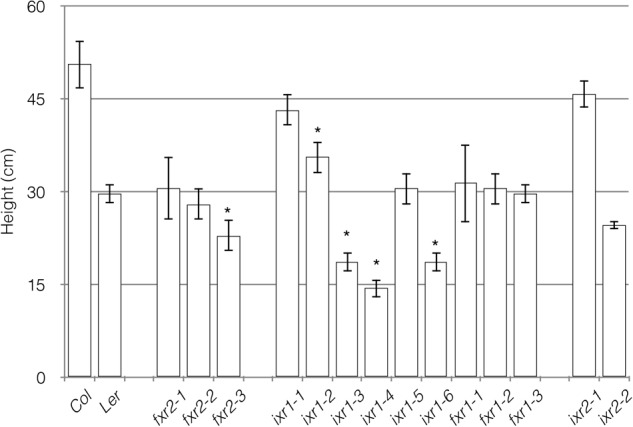
Average plant heights measured in mature wild-type and mutant plants. Values are averages ± SD (n = 6, ∗P ≤ 0.05 using Student’s t-test).

Average plant heights measured in mature wild-type and mutant plants. Values are averages ± SD (n = 6, ∗P ≤ 0.05 using Student’s t-test).