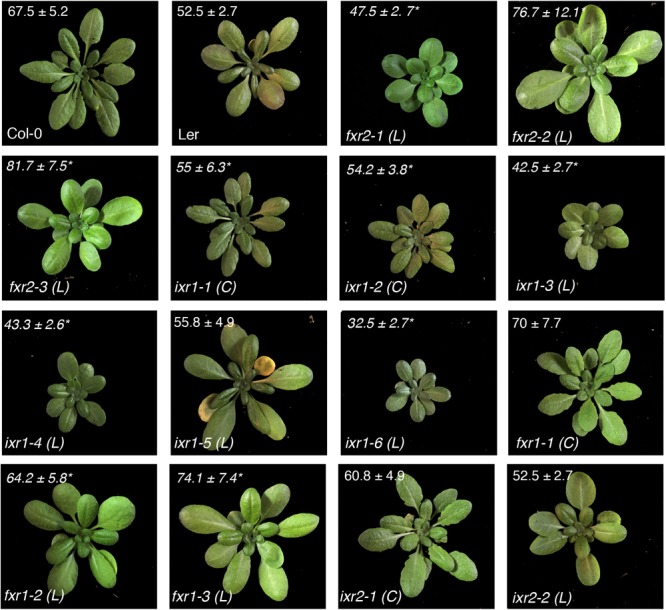
FIGURE 5.

Representative appearance and size of rosettes. Rosette diameters (cm) at the onset of bolting measured as the distance from the edges of the rosette leaves are shown ± SD (n = 6, ∗P < 0.05 using Student’s t-test). Ecotype backgrounds for Col-0 (C) or Ler (L) are indicated next to mutant alleles.
