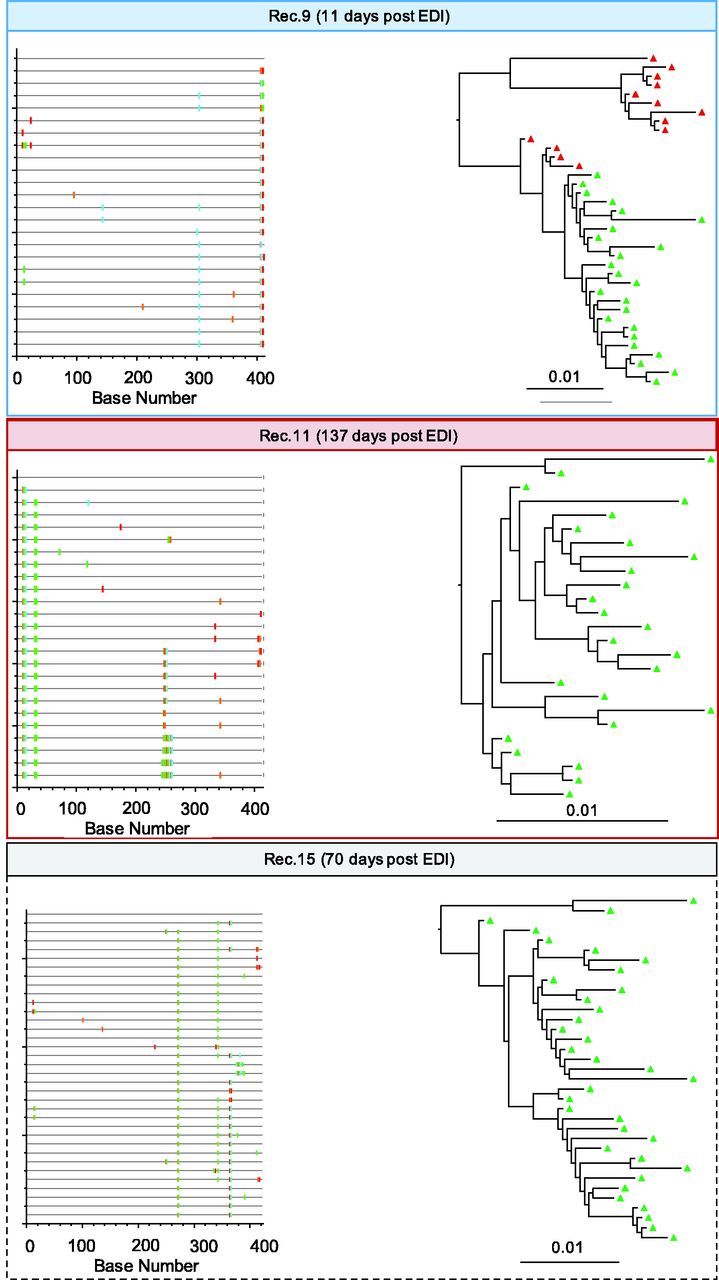
Figure 2.

Highlighter plots and ML phylogenetic trees from baseline samples for recipients 9, 11, and 15. Baseline samples were collected after 11, 137, and 70 days respectively. Single (recipient 9) and multiple (recipient 11) founders are inferred based upon highlighter plots, tree topologies, and maximum viral diversity are indicated in red (multiple) and blue (single) squared boxes. Unresolved case (recipient 15) is squared with dashed black lines. ML trees are midpoint rooted. The scale bar represents a genetic distance of 0.01 for all pairs. EDI Estimated date of infection. The entire dataset of thirty recipients is proposed in Supplementary Figure S2.
