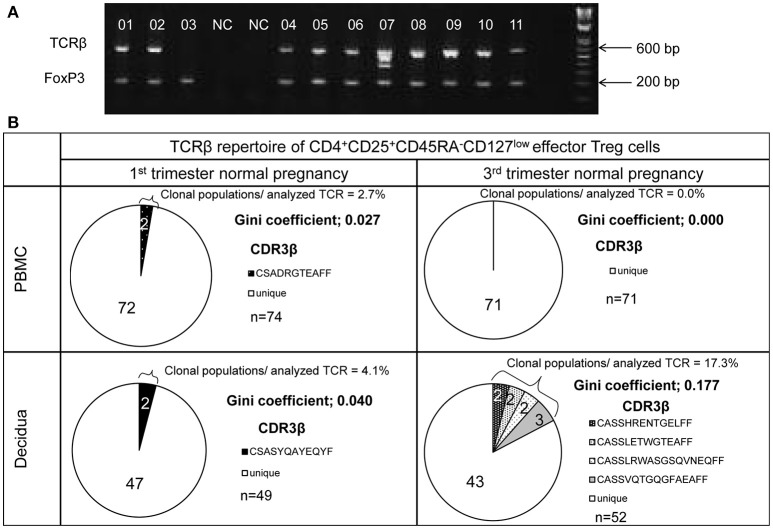
Figure 2.
TCRβ repertoire analysis of CD4+CD45RA−CD25+CD127low/− effector Treg cells. (A) TCRβ and FoxP3 cDNAs amplified by multiplex one-step RT-PCR were resolved by agarose gel electrophoresis. Each single cell was numbered. NC denotes the cell-free negative control. FoxP3 and TCRβ mRNAs were expressed in 11/11 and 10/11, respectively. (B) Representative data of the TCRβ repertoire of CD4+CD45RA−CD25+CD127low/−effector Treg cells in PBMC and decidua. The TCR repertoires were determined by amino acid and nucleotide sequences of complementarity determining region 3 (CDR3) of TCRβ chain. Each pie chart slice (shaded or closed) indicates clonal T cell population with the same clonotypic TCRβ. An open pie chart slice indicates T cells with unique TCRβ. Frequency of clonal populations among analyzed TCRβ and the Gini coefficients of the TCRβ repertoire were calculated.

