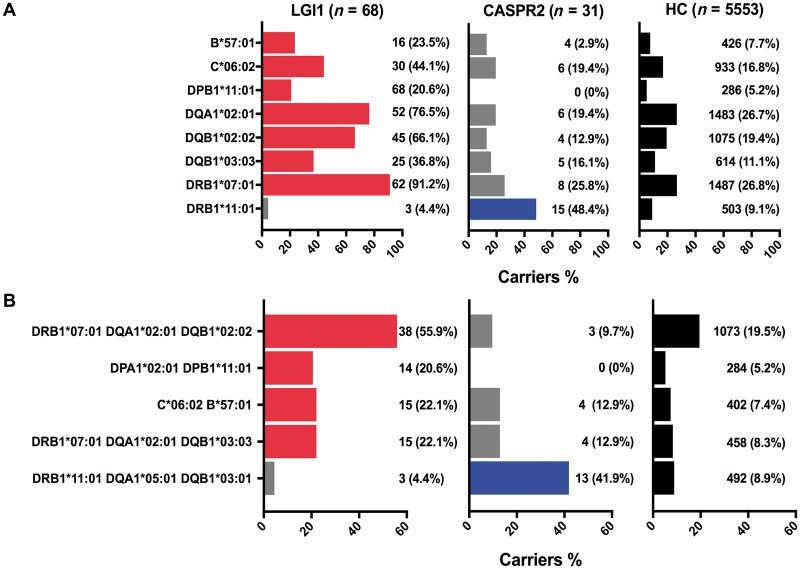
Figure 1.
HLA allele and haplotype associations in patients with LGI1 and CASPR2 antibodies. Bar chart depicting allele (A) and haplotype (B) associations and their frequency in patients with antibodies to LGI1 (n = 68, red denotes significant associations) and CASPR2 (n = 31, blue denotes significant associations), together with the frequency of these alleles or haplotypes in 5553 healthy controls (black bars). HC = healthy controls.

