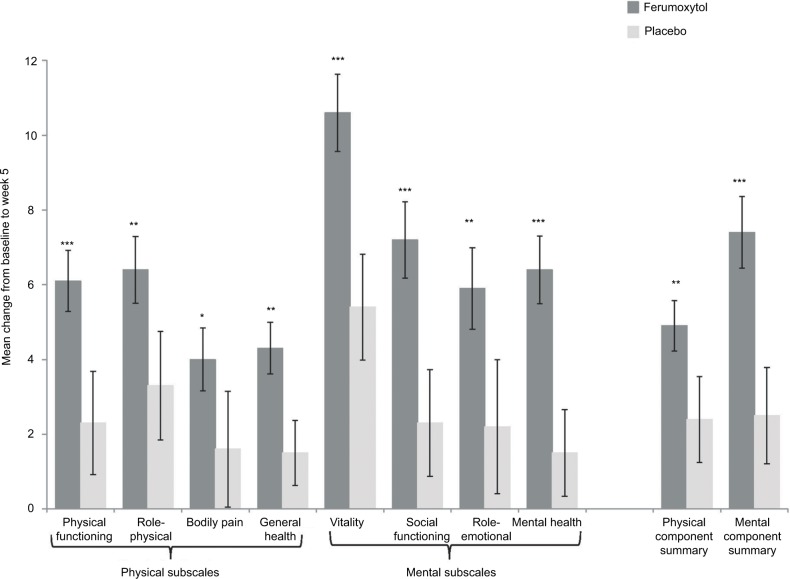
Figure 4.
Mean change from baseline to week 5 with the 36-Item Short Form Health Survey.
Notes: Between-group difference in change scores: *P<0.05; **P<0.01; ***P<0.001. P-value was derived from the least-squares mean and an analysis of covariance model, adjusted for baseline hemoglobin and underlying condition. Error bars represent the 95% CI (1.96× standard error). Copyrighted 2016. Frontline Medical Communications. 268243:0618CH. Reprinted from Strauss W, Dahl N, Vadhan-Raj S, et al. Effects of IV iron treatment with ferumoxytol on health-related quality of life of patients with iron deficiency anemia. J Community Support Oncol. 2016;14(8):342–350.47

