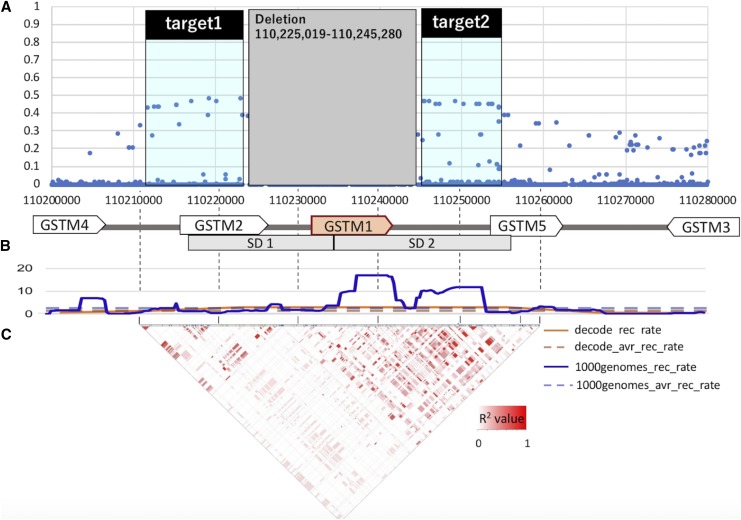
Figure 2.
Linkage disequilibrium in the GSTM1 region in CHB. (A) R2 value between the GSTM1 deletion and flanking single nucleotide variants in CHB. Each dot represent each single nucleotide variants. X-axis indicates chromosomal location and Y-axis indicates the R2 value between the GSTM1 deletion and flanking single nucleotide variants. Target regions were chr1:110211681-110223007 (target1, upstream the deletion) and chr1:110246810-110255596 (target2, downstream the deletion). (B) Recombination rate of the GSTM1 flanking region from DeCode (orange) and 1000genomes (blue). The chromosomal average of recombination rate from decode (orange) and 1000genomes (blue) were also plotted in the graph by broken lines. (C) Linkage disequilibrium (LD, R2 value) between the single nucleotide variants around the GSTM1 gene in CHB. Color coded in a continuous R2 values between each single nucleotide variants from 0 (white) to 1 (red).

