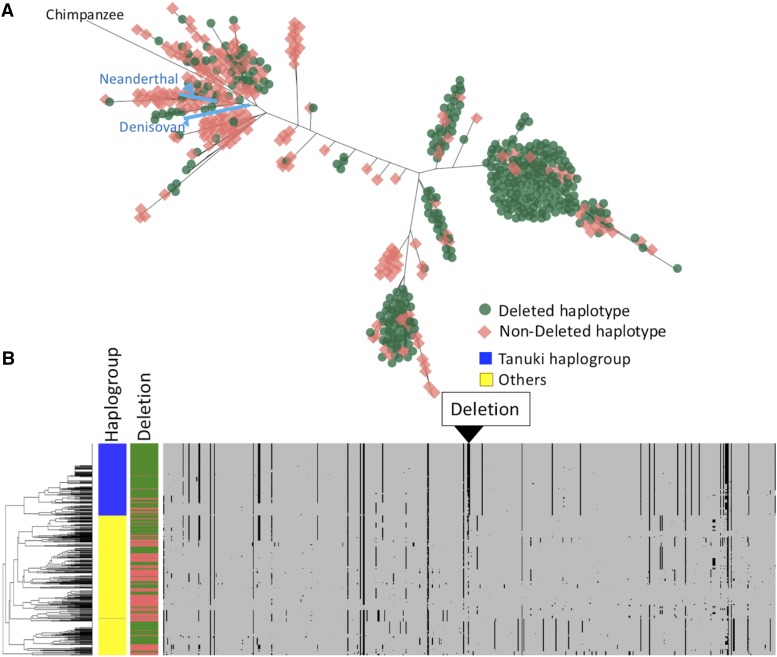
Figure 3.
Haplotypes of the combined target1 and target2 regions. (A) The phylogenetic relationship of the downstream target 2 region of CEU, YRI, CHB, Neanderthal, Denisovan and Chimpanzee constructed by the maximum-likelihood method. The GSTM1-deleted haplotypes were marked by green and the GSTM1-non-deleted haplotypes were marked by red manually. (B) Clustered haplotypes of the upstream target 1 region and downstream target 2 regions of CHB and CEU. The clustering was conducted based only on the haplotypes themselves with neither a priori input of haplogroups nor the deletion status. The GSTM1-deleted haplotypes were marked by green and the GSTM1-non-deleted haplotypes were marked by red. The Tanuki haplogroup, which showed high population differentiation, was marked by blue and other haplotypes were marked by yellow.

