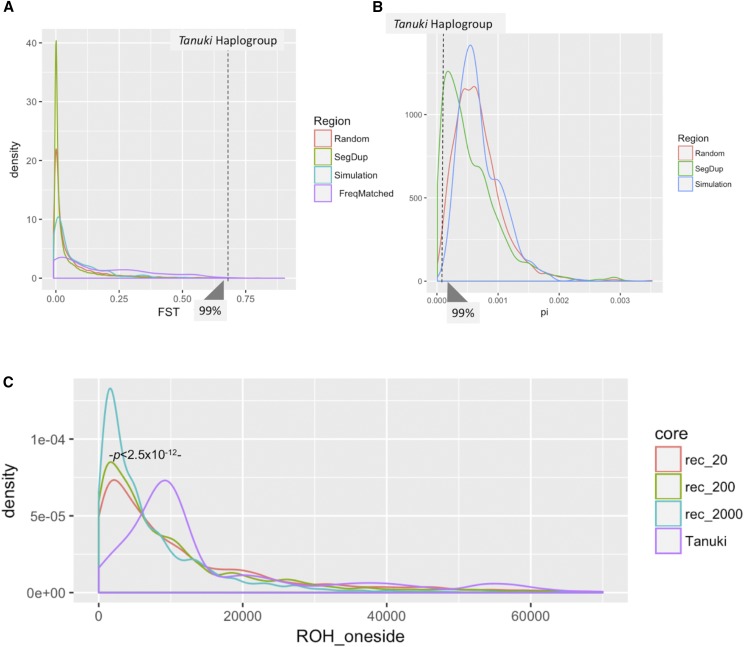
Figure 5.
(A) The average values of FST for Tanuki SNPs (dotted line), the 1000 randomly selected 9kb regions (red), 9kb regions on chromosome 1 that overlap with segmental duplications (green), simulated data under neutrality (blue), and frequency-matched (0.69 - 0.70) single nucleotide variants on chromosome 1 (purple). We found that none of 603 frequency-matched simulated FST is higher than the observed FST for the Tanuki haplogroup. (B) The π value for Tanuki haplotypes (dotted line), the 1000 randomly selected 9kb regions (red), 9kb regions on chromosome 1 that overlap with segmental duplications (green), simulated data under neutrality (blue). The results showed that π observed in the Tanuki haplogroup is lowest among 389 frequency-matched simulated values. (C) The Run of Homozygosity of the Tanuki SNP (purple) and simulated frequency-matched SNPs with 3 different recombination rates, 20 (red), 200 (green), 2000 (blue). We found that the ROH values observed for the Tanuki single nucleotide variants in the 1KGP East Asian populations is significantly higher than what is expected under neutrality based on frequency matched simulation results with r = 200, the most realistic parameter from the observation (Fig. 5C, P < 2.5x10⁻¹², Wilcoxon-Rank-Sum Test).

