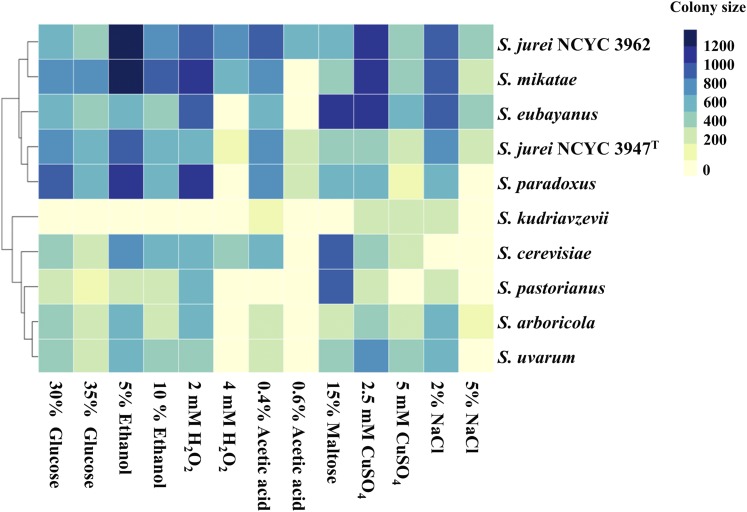
Figure 3.
Heat map representing phenotypic fitness of S. jurei NCYC 3947T and NCYC 3962 compared to sensu stricto species type strains in response to different environmental stressors at 30°C. Phenotypes are represented with colony sizes calculated as pixels and colored according to the scale, with light yellow and dark blue colors representing the lowest and highest growth respectively. Hierarchical clustering of the strains is based on the overall growth profile under different media conditions tested.

