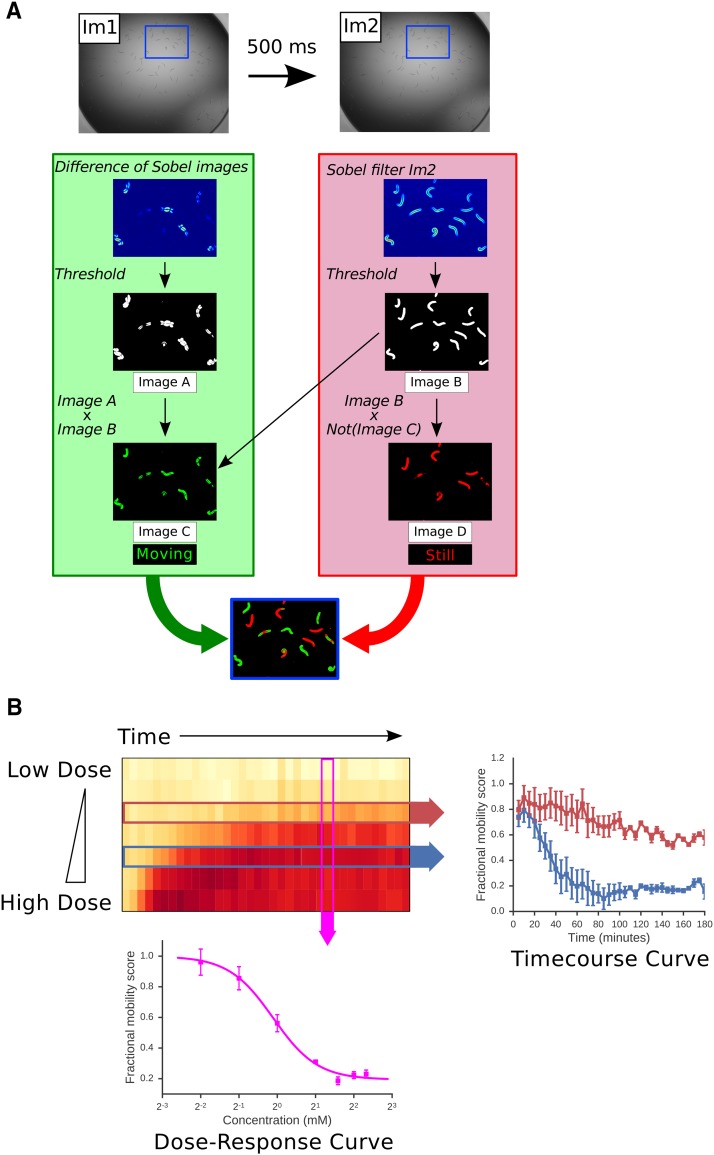
Figure 1.
Outline of an image-based assay for worm mobility. A: Worms are placed in a 96 well plate in M9 buffer and treated with drugs as required. Two images of each well (Im1 and Im2) are captured at an interval of 500 ms at each timepoint. Images are processed as described in Materials and Methods to identify portions of the worms that move between the two images (green) and parts that remain stationary (red). This allows the calculation of a raw fractional mobility score (FMS) as the fraction of total worm-associated pixels (red and green) that moved (green). This processing is illustrated in a magnified region of Im1 and Im2 (defined by blue box). B: The image-based assay produces a rich view of drug effects on worm movement. L4 worms were treated with a range of doses of aldicarb and movement measured at 5 min time points over a 3 hr time course. The heat map shows the FMS for each drug dose at each timepoint — white indicates full movement, red indicates lack of movement. Either dose response curves at a given time point (pink arrow) or kinetic responses to a single drug dose (red and blue arrows) can be extracted from these rich data. Data are means of four independent experiments. Error bars show standard error of the mean.

