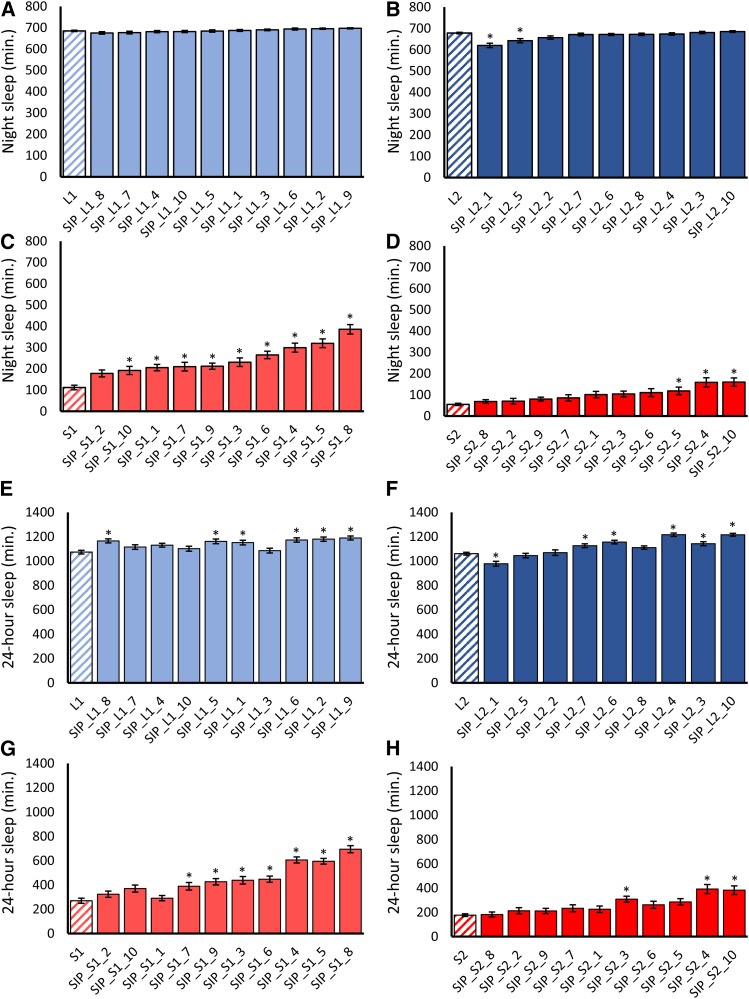
Figure 2.
Night sleep and 24-hour sleep in the Sleep Inbred Panel. Mean night sleep ± SE is plotted for each line of the SIP as compared to the mean of its corresponding progenitor population. SIP lines are ordered from the shortest night sleep to the longest. Solid colors indicate SIP line; diagonal bars indicate the mean of the progenitor population as reported in (Harbison et al. 2017). (A-D) Night sleep in SIP lines derived from the (A) L1 population; (B) L2 population; (C) S1 population; and (D) S2 population. (E-H) 24-hour sleep in SIP lines derived from the (E) L1 population; (F) L2 population; (G) S1 population; and (H) S2 population. Asterisks indicate lines with sleep duration significantly different (P < 0.05) from the progenitor population.

