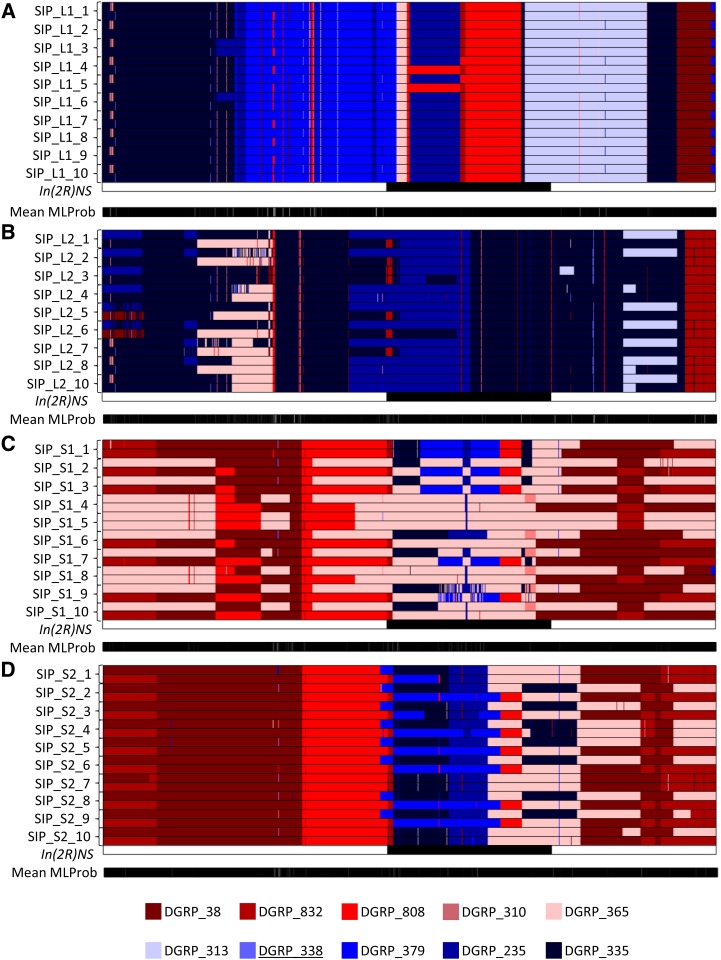
Figure 3.
Plot of predicted DGRP founder haplotypes on chromosome 2R from Hidden Markov Model. In each plot, the predicted founder haplotypes are plotted along the length of the chromosome. Short-sleeping founder genotypes are coded in shades of red per the legend at the bottom of the figure; long-sleeping founder lines are coded in shades of blue. The location of chromosomal inversions is indicated by black bars for inversions that were present in the 10 DGRP founder lines. Underlined DGRP lines listed in the legend are heterozygous for the indicated inversion. The average posterior probability is given as a bar underneath the chromosome schematic graded from a probability of 1.0 (black) to 0.0 (white). (A), Lines derived from L1; (B), Lines derived from L2; (C), Lines derived from S1; (D), Lines derived from S2.

