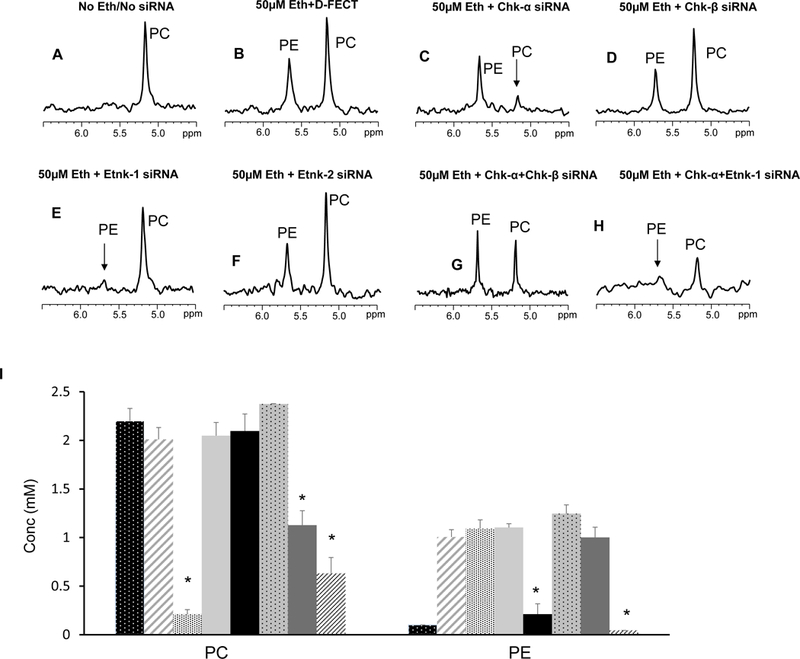
Figure 1:

Representative 31P MR spectra showing expanded regions of PC and PE metabolites from cell extracts of (A) untreated MDA-MB-231 cells, (B) cells treated with 50 μM ethanolamine+D-FECT, (C) cells treated with 50 μM ethanolamine and Chk-α siRNA, (D) cells treated with 50 μM ethanolamine and Chk-β siRNA, (E) cells treated with 50 μM ethanolamine and Etnk-1 siRNA, (F) cells treated with 50 μM ethanolamine and Etnk-2 siRNA, (G) cells treated with 50 μM ethanolamine and Chk-α + Chk- β siRNA, and (H) cells treated with cells treated with 50 μM ethanolamine and Chk-α and Etnk-1 siRNA. (I) Quantitative PC and PE values obtained from 31P MR spectra obtained from MDA-MB-231 cell lines. (* represents p < 0.05 compared to treatment with D-FECT. Values represent Mean + SEM. No treatment/No siRNA ( , n=5); D-FECT+50μM Ethanolamine (
 ,n=7 ); 50μM Ethanolamine+Chk-α siRNA (
 ,n=4); 50μM Ethanolamine+Chk-β siRNA (
 , n=3); 50μM Ethanolamine+Etnk-1 siRNA (
 , n=4); 50μM Ethanolamine+Etnk-2 siRNA (
 , n=3); 50μM Ethanolamine+Chk-α+Chk-β siRNA (
 , n=4); 50μM Ethanolamine+Chk-α+Etnk-1 siRNA (
 , n=4).
