Figure 7.
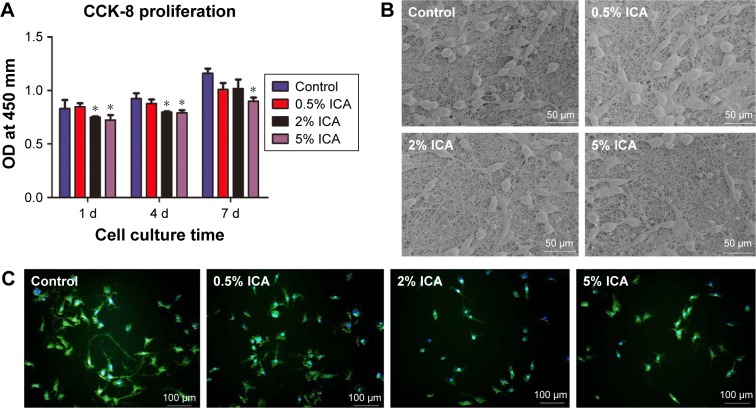
Cell adhesion and proliferation on the surface of different membranes.
Notes: (A) OD of fibroblast cells after 1 day, 4 days and 7 days (*P<0.05 compared with the control group); the SEM micrographs (B) and fluorescent images (C) of cells cultured for 4 days.
Abbreviations: CCK-8, Cell Counting Kit-8; d, days; ICA, icariin; SEM, scanning electron microscopy.

