
Figure 4. VacA-induced IL-8 and IL-6 production.
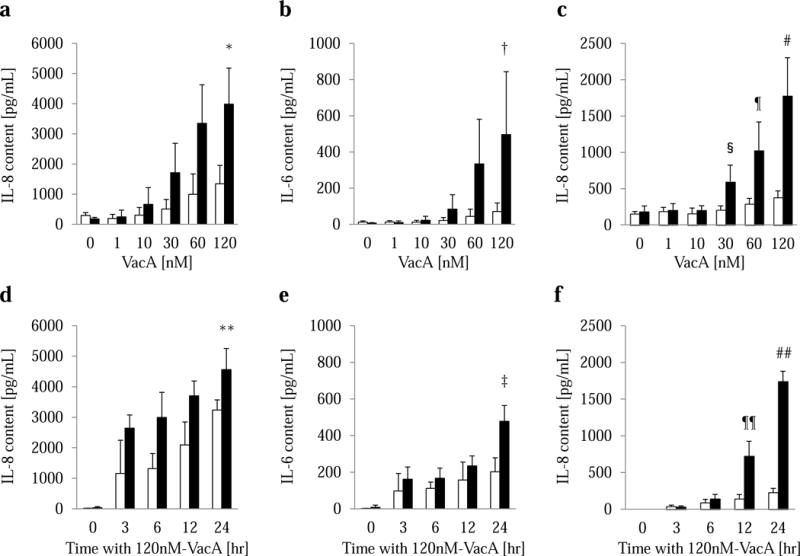
a–c: A549 cells and normal human bronchial epithelial (NHBE) cells were incubated with the indicated concentrations of VacA (■) or heat-inactivated VacA (iVacA, control, □) for 24 h (0–120 nM); incubation with VacA for 24 h resulted in concentration-dependent increases in IL-8 (a) and IL-6 (b) in the medium of A549 cells and IL-8 (c) in that of NHBE cells. * denotes a statistically significant difference as compared with 0, 1, 10, or 30 nM VacA and 120 nM iVacA (p < 0.05), † with 0, 1, or 10 nM VacA and 120 nM iVacA (p < 0.05), # with 0, 1, 10, 30, 60 nM VacA and 120 nM iVacA (p < 0.05), f with 0, 1, 10 nM VacA and 60 nM iVacA (p < 0.05) and § with 30 nM iVacA (p < 0.05). d–f: A549 and NHBE cells were incubated with 120nM VacA (■) or iVacA (□) for the indicated times (0–24 h). There were time-dependent increases in IL-8 (d) and IL-6 (e) contents in the supernatants of A549 cells and IL-8 (f) in that of NHBE cells following incubation with 120 nM VacA. ** denotes a statistically significant difference as compared with 0, 3, 6 h with VacA and 24 h with iVacA (p < 0.05), ‡ with 0, 3, 6 h with VacA and 24 h with iVacA (p < 0.05), ## with 0, 3, 6,12 h VacA and 24 h iVacA (p < 0.05) and ¶¶ with 0, 3, 6 h VacA and 12 h iVacA (p < 0.05). All measurements were performed in duplicate, and the values reported are the means of 4 experiments.